Поиск по блогу

среда, 25 февраля 2015 г.

Копипаст второй части о подготовке данных "Data Wrangling with Pandas" (часть 2)

Вот заголовки и ключевые слова для поиска: Date/Time, log.histogram, datetime.strptime(segments.st_time.ix[0], '%m/%d/%y %H:%M') Merging, Concatenation( binding or stacking), Reshaping DataFrame objects, Pivoting, Value replacement Inidcator variables (design matrix), Discretization Permutation and sampling, Data aggregation and GroupBy operations, split-apply-combine operation, Apply

Now that we have been exposed to the basic functionality of Pandas, lets explore some more advanced features that will be useful when addressing more complex data management tasks.

As most statisticians/data analysts will admit, often the lion's share of the time spent implementing an analysis is devoted to preparing the data itself, rather than to coding or running a particular model that uses the data. This is where Pandas and Python's standard library are beneficial, providing high-level, flexible, and efficient tools for manipulating your data as needed.

In [1]:
%matplotlib inline
import pandas as pd
import numpy as np
import matplotlib.pyplot as plt

# Set some Pandas options
pd.set_option('display.notebook_repr_html', False)
pd.set_option('display.max_columns', 20)
pd.set_option('display.max_rows', 25)

Date/Time data handling

Date and time data are inherently problematic. There are an unequal number of days in every month, an unequal number of days in a year (due to leap years), and time zones that vary over space. Yet information about time is essential in many analyses, particularly in the case of time series analysis.

The datetime built-in library handles temporal information down to the nanosecond.

In [2]:
from datetime import datetime
In [3]:
now = datetime.now()
now
Out[3]:
datetime.datetime(2014, 6, 18, 10, 40, 0, 248479)
In [4]:
now.day
Out[4]:
18
In [5]:
now.weekday()
Out[5]:
2

In addition to datetime there are simpler objects for date and time information only, respectively.

In [6]:
from datetime import date, time
In [7]:
time(3, 24)
Out[7]:
datetime.time(3, 24)
In [8]:
date(1970, 9, 3)
Out[8]:
datetime.date(1970, 9, 3)

Having a custom data type for dates and times is convenient because we can perform operations on them easily. For example, we may want to calculate the difference between two times:

In [9]:
my_age = now - datetime(1970, 9, 3)
my_age
Out[9]:
datetime.timedelta(15994, 38400, 248479)
In [10]:
my_age.days/365.
Out[10]:
43.81917808219178

In this section, we will manipulate data collected from ocean-going vessels on the eastern seaboard. Vessel operations are monitored using the Automatic Identification System (AIS), a safety at sea navigation technology which vessels are required to maintain and that uses transponders to transmit very high frequency (VHF) radio signals containing static information including ship name, call sign, and country of origin, as well as dynamic information unique to a particular voyage such as vessel location, heading, and speed.

The International Maritime Organization’s (IMO) International Convention for the Safety of Life at Sea requires functioning AIS capabilities on all vessels 300 gross tons or greater and the US Coast Guard requires AIS on nearly all vessels sailing in U.S. waters. The Coast Guard has established a national network of AIS receivers that provides coverage of nearly all U.S. waters. AIS signals are transmitted several times each minute and the network is capable of handling thousands of reports per minute and updates as often as every two seconds. Therefore, a typical voyage in our study might include the transmission of hundreds or thousands of AIS encoded signals. This provides a rich source of spatial data that includes both spatial and temporal information.

For our purposes, we will use summarized data that describes the transit of a given vessel through a particular administrative area. The data includes the start and end time of the transit segment, as well as information about the speed of the vessel, how far it travelled, etc.

In [11]:
segments = pd.read_csv("data/AIS/transit_segments.csv")
segments.head()
Out[11]:
   mmsi               name  transit  segment  seg_length  avg_sog  min_sog  \
0     1        Us Govt Ves        1        1         5.1     13.2      9.2   
1     1  Dredge Capt Frank        1        1        13.5     18.6     10.4   
2     1      Us Gov Vessel        1        1         4.3     16.2     10.3   
3     1      Us Gov Vessel        2        1         9.2     15.4     14.5   
4     1  Dredge Capt Frank        2        1         9.2     15.4     14.6   

   max_sog  pdgt10        st_time       end_time  
0     14.5    96.5  2/10/09 16:03  2/10/09 16:27  
1     20.6   100.0   4/6/09 14:31   4/6/09 15:20  
2     20.5   100.0   4/6/09 14:36   4/6/09 14:55  
3     16.1   100.0  4/10/09 17:58  4/10/09 18:34  
4     16.2   100.0  4/10/09 17:59  4/10/09 18:35  

For example, we might be interested in the distribution of transit lengths, so we can plot them as a histogram:

In [12]:
segments.seg_length.hist(bins=500)
Out[12]:
<matplotlib.axes._subplots.AxesSubplot at 0x117716bd0>

Though most of the transits appear to be short, there are a few longer distances that make the plot difficult to read. This is where a transformation is useful:

In [13]:
segments.seg_length.apply(np.log).hist(bins=500)
Out[13]:
<matplotlib.axes._subplots.AxesSubplot at 0x11382bb90>

We can see that although there are date/time fields in the dataset, they are not in any specialized format, such as datetime.

In [14]:
segments.st_time.dtype
Out[14]:
dtype('O')

Our first order of business will be to convert these data to datetime. The strptime method parses a string representation of a date and/or time field, according to the expected format of this information.

In [15]:
datetime.strptime(segments.st_time.ix[0], '%m/%d/%y %H:%M')
Out[15]:
datetime.datetime(2009, 2, 10, 16, 3)

The dateutil package includes a parser that attempts to detect the format of the date strings, and convert them automatically.

In [16]:
from dateutil.parser import parse
In [17]:
parse(segments.st_time.ix[0])
Out[17]:
datetime.datetime(2009, 2, 10, 16, 3)

We can convert all the dates in a particular column by using the apply method.

In [18]:
segments.st_time.apply(lambda d: datetime.strptime(d, '%m/%d/%y %H:%M'))
Out[18]:
0   2009-02-10 16:03:00
1   2009-04-06 14:31:00
2   2009-04-06 14:36:00
3   2009-04-10 17:58:00
4   2009-04-10 17:59:00
5   2010-03-20 16:06:00
6   2010-03-20 18:05:00
7   2011-05-04 11:28:00
8   2010-06-05 11:23:00
9   2010-06-08 11:03:00
...
262515   2010-05-31 14:27:00
262516   2010-06-05 05:25:00
262517   2010-06-27 02:35:00
262518   2010-07-01 03:49:00
262519   2010-07-02 03:30:00
262520   2010-06-13 10:32:00
262521   2010-06-15 12:49:00
262522   2010-06-15 21:32:00
262523   2010-06-17 19:16:00
262524   2010-06-18 02:52:00
262525   2010-06-18 10:19:00
Name: st_time, Length: 262526, dtype: datetime64[ns]

As a convenience, Pandas has a to_datetime method that will parse and convert an entire Series of formatted strings into datetime objects.

In [19]:
pd.to_datetime(segments.st_time)
Out[19]:
0   2009-02-10 16:03:00
1   2009-04-06 14:31:00
2   2009-04-06 14:36:00
3   2009-04-10 17:58:00
4   2009-04-10 17:59:00
5   2010-03-20 16:06:00
6   2010-03-20 18:05:00
7   2011-05-04 11:28:00
8   2010-06-05 11:23:00
9   2010-06-08 11:03:00
...
262515   2010-05-31 14:27:00
262516   2010-06-05 05:25:00
262517   2010-06-27 02:35:00
262518   2010-07-01 03:49:00
262519   2010-07-02 03:30:00
262520   2010-06-13 10:32:00
262521   2010-06-15 12:49:00
262522   2010-06-15 21:32:00
262523   2010-06-17 19:16:00
262524   2010-06-18 02:52:00
262525   2010-06-18 10:19:00
Name: st_time, Length: 262526, dtype: datetime64[ns]

Pandas also has a custom NA value for missing datetime objects, NaT.

In [20]:
pd.to_datetime([None])
Out[20]:
<class 'pandas.tseries.index.DatetimeIndex'>
[NaT]
Length: 1, Freq: None, Timezone: None

Also, if to_datetime() has problems parsing any particular date/time format, you can pass the spec in using the format= argument.

Merging and joining DataFrame objects

Now that we have the vessel transit information as we need it, we may want a little more information regarding the vessels themselves. In the data/AIS folder there is a second table that contains information about each of the ships that traveled the segments in the segments table.

In [21]:
vessels = pd.read_csv("data/AIS/vessel_information.csv", index_col='mmsi')
vessels.head()
Out[21]:
      num_names                                              names sov  \
mmsi                                                                     
1             8  Bil Holman Dredge/Dredge Capt Frank/Emo/Offsho...   Y   
9             3                         000000009/Raven/Shearwater   N   
21            1                                      Us Gov Vessel   Y   
74            2                                  Mcfaul/Sarah Bell   N   
103           3           Ron G/Us Navy Warship 103/Us Warship 103   Y   

         flag flag_type  num_loas                                    loa  \
mmsi                                                                       
1     Unknown   Unknown         7  42.0/48.0/57.0/90.0/138.0/154.0/156.0   
9     Unknown   Unknown         2                              50.0/62.0   
21    Unknown   Unknown         1                                  208.0   
74    Unknown   Unknown         1                                  155.0   
103   Unknown   Unknown         2                             26.0/155.0   

      max_loa  num_types                             type  
mmsi                                                       
1         156          4  Dredging/MilOps/Reserved/Towing  
9          62          2                     Pleasure/Tug  
21        208          1                          Unknown  
74        155          1                          Unknown  
103       155          2                   Tanker/Unknown  
In [22]:
[v for v in vessels.type.unique() if v.find('/')==-1]
Out[22]:
['Unknown',
 'Other',
 'Tug',
 'Towing',
 'Pleasure',
 'Cargo',
 'WIG',
 'Fishing',
 'BigTow',
 'MilOps',
 'Tanker',
 'Passenger',
 'SAR',
 'Sailing',
 'Reserved',
 'Law',
 'Dredging',
 'AntiPol',
 'Pilot',
 'HSC',
 'Diving',
 'Resol-18',
 'Tender',
 'Spare',
 'Medical']
In [23]:
vessels.type.value_counts()
Out[23]:
Cargo        5622
Tanker       2440
Pleasure      601
Tug           221
Sailing       205
Fishing       200
Other         178
Passenger     150
Towing        117
Unknown       106
...
BigTow/Tanker/Towing/Tug          1
Fishing/SAR/Unknown               1
BigTow/Reserved/Towing/Tug/WIG    1
Reserved/Tanker/Towing/Tug        1
Cargo/Reserved/Unknown            1
Reserved/Towing/Tug               1
BigTow/Unknown                    1
Fishing/Law                       1
BigTow/Towing/WIG                 1
Towing/Unknown/WIG                1
AntiPol/Fishing/Pleasure          1
Length: 206, dtype: int64

The challenge, however, is that several ships have travelled multiple segments, so there is not a one-to-one relationship between the rows of the two tables. The table of vessel information has a one-to-many relationship with the segments.

In Pandas, we can combine tables according to the value of one or more keys that are used to identify rows, much like an index. Using a trivial example:

In [24]:
df1 = pd.DataFrame(dict(id=range(4), age=np.random.randint(18, 31, size=4)))
df2 = pd.DataFrame(dict(id=range(3)+range(3), score=np.random.random(size=6)))

df1, df2
Out[24]:
(   age  id
 0   24   0
 1   25   1
 2   25   2
 3   30   3,    id     score
 0   0  0.068840
 1   1  0.784715
 2   2  0.590726
 3   0  0.892117
 4   1  0.506912
 5   2  0.721110)
In [25]:
pd.merge(df1, df2)
Out[25]:
   age  id     score
0   24   0  0.068840
1   24   0  0.892117
2   25   1  0.784715
3   25   1  0.506912
4   25   2  0.590726
5   25   2  0.721110

Notice that without any information about which column to use as a key, Pandas did the right thing and used the id column in both tables. Unless specified otherwise, merge will used any common column names as keys for merging the tables.

Notice also that id=3 from df1 was omitted from the merged table. This is because, by default, merge performs an inner join on the tables, meaning that the merged table represents an intersection of the two tables.

In [26]:
pd.merge(df1, df2, how='outer')
Out[26]:
   age  id     score
0   24   0  0.068840
1   24   0  0.892117
2   25   1  0.784715
3   25   1  0.506912
4   25   2  0.590726
5   25   2  0.721110
6   30   3       NaN

The outer join above yields the union of the two tables, so all rows are represented, with missing values inserted as appropriate. One can also perform right and left joins to include all rows of the right or left table (i.e. first or second argument to merge), but not necessarily the other.

Looking at the two datasets that we wish to merge:

In [27]:
segments.head(1)
Out[27]:
   mmsi         name  transit  segment  seg_length  avg_sog  min_sog  max_sog  \
0     1  Us Govt Ves        1        1         5.1     13.2      9.2     14.5   

   pdgt10        st_time       end_time  
0    96.5  2/10/09 16:03  2/10/09 16:27  
In [28]:
vessels.head(1)
Out[28]:
      num_names                                              names sov  \
mmsi                                                                     
1             8  Bil Holman Dredge/Dredge Capt Frank/Emo/Offsho...   Y   

         flag flag_type  num_loas                                    loa  \
mmsi                                                                       
1     Unknown   Unknown         7  42.0/48.0/57.0/90.0/138.0/154.0/156.0   

      max_loa  num_types                             type  
mmsi                                                       
1         156          4  Dredging/MilOps/Reserved/Towing  

we see that there is a mmsi value (a vessel identifier) in each table, but it is used as an index for the vessels table. In this case, we have to specify to join on the index for this table, and on the mmsi column for the other.

In [29]:
segments_merged = pd.merge(vessels, segments, left_index=True, right_on='mmsi')
In [30]:
segments_merged.head()
Out[30]:
   num_names                                              names sov     flag  \
0          8  Bil Holman Dredge/Dredge Capt Frank/Emo/Offsho...   Y  Unknown   
1          8  Bil Holman Dredge/Dredge Capt Frank/Emo/Offsho...   Y  Unknown   
2          8  Bil Holman Dredge/Dredge Capt Frank/Emo/Offsho...   Y  Unknown   
3          8  Bil Holman Dredge/Dredge Capt Frank/Emo/Offsho...   Y  Unknown   
4          8  Bil Holman Dredge/Dredge Capt Frank/Emo/Offsho...   Y  Unknown   

  flag_type  num_loas                                    loa  max_loa  \
0   Unknown         7  42.0/48.0/57.0/90.0/138.0/154.0/156.0      156   
1   Unknown         7  42.0/48.0/57.0/90.0/138.0/154.0/156.0      156   
2   Unknown         7  42.0/48.0/57.0/90.0/138.0/154.0/156.0      156   
3   Unknown         7  42.0/48.0/57.0/90.0/138.0/154.0/156.0      156   
4   Unknown         7  42.0/48.0/57.0/90.0/138.0/154.0/156.0      156   

   num_types                             type  \
0          4  Dredging/MilOps/Reserved/Towing   
1          4  Dredging/MilOps/Reserved/Towing   
2          4  Dredging/MilOps/Reserved/Towing   
3          4  Dredging/MilOps/Reserved/Towing   
4          4  Dredging/MilOps/Reserved/Towing   

                ...                              name transit  segment  \
0               ...                       Us Govt Ves       1        1   
1               ...                 Dredge Capt Frank       1        1   
2               ...                     Us Gov Vessel       1        1   
3               ...                     Us Gov Vessel       2        1   
4               ...                 Dredge Capt Frank       2        1   

   seg_length  avg_sog  min_sog  max_sog  pdgt10        st_time       end_time  
0         5.1     13.2      9.2     14.5    96.5  2/10/09 16:03  2/10/09 16:27  
1        13.5     18.6     10.4     20.6   100.0   4/6/09 14:31   4/6/09 15:20  
2         4.3     16.2     10.3     20.5   100.0   4/6/09 14:36   4/6/09 14:55  
3         9.2     15.4     14.5     16.1   100.0  4/10/09 17:58  4/10/09 18:34  
4         9.2     15.4     14.6     16.2   100.0  4/10/09 17:59  4/10/09 18:35  

[5 rows x 21 columns]

In this case, the default inner join is suitable; we are not interested in observations from either table that do not have corresponding entries in the other.

Notice that mmsi field that was an index on the vessels table is no longer an index on the merged table.

Here, we used the merge function to perform the merge; we could also have used the merge method for either of the tables:

In [31]:
vessels.merge(segments, left_index=True, right_on='mmsi').head()
Out[31]:
   num_names                                              names sov     flag  \
0          8  Bil Holman Dredge/Dredge Capt Frank/Emo/Offsho...   Y  Unknown   
1          8  Bil Holman Dredge/Dredge Capt Frank/Emo/Offsho...   Y  Unknown   
2          8  Bil Holman Dredge/Dredge Capt Frank/Emo/Offsho...   Y  Unknown   
3          8  Bil Holman Dredge/Dredge Capt Frank/Emo/Offsho...   Y  Unknown   
4          8  Bil Holman Dredge/Dredge Capt Frank/Emo/Offsho...   Y  Unknown   

  flag_type  num_loas                                    loa  max_loa  \
0   Unknown         7  42.0/48.0/57.0/90.0/138.0/154.0/156.0      156   
1   Unknown         7  42.0/48.0/57.0/90.0/138.0/154.0/156.0      156   
2   Unknown         7  42.0/48.0/57.0/90.0/138.0/154.0/156.0      156   
3   Unknown         7  42.0/48.0/57.0/90.0/138.0/154.0/156.0      156   
4   Unknown         7  42.0/48.0/57.0/90.0/138.0/154.0/156.0      156   

   num_types                             type  \
0          4  Dredging/MilOps/Reserved/Towing   
1          4  Dredging/MilOps/Reserved/Towing   
2          4  Dredging/MilOps/Reserved/Towing   
3          4  Dredging/MilOps/Reserved/Towing   
4          4  Dredging/MilOps/Reserved/Towing   

                ...                              name transit  segment  \
0               ...                       Us Govt Ves       1        1   
1               ...                 Dredge Capt Frank       1        1   
2               ...                     Us Gov Vessel       1        1   
3               ...                     Us Gov Vessel       2        1   
4               ...                 Dredge Capt Frank       2        1   

   seg_length  avg_sog  min_sog  max_sog  pdgt10        st_time       end_time  
0         5.1     13.2      9.2     14.5    96.5  2/10/09 16:03  2/10/09 16:27  
1        13.5     18.6     10.4     20.6   100.0   4/6/09 14:31   4/6/09 15:20  
2         4.3     16.2     10.3     20.5   100.0   4/6/09 14:36   4/6/09 14:55  
3         9.2     15.4     14.5     16.1   100.0  4/10/09 17:58  4/10/09 18:34  
4         9.2     15.4     14.6     16.2   100.0  4/10/09 17:59  4/10/09 18:35  

[5 rows x 21 columns]

Occasionally, there will be fields with the same in both tables that we do not wish to use to join the tables; they may contain different information, despite having the same name. In this case, Pandas will by default append suffixes _x and _y to the columns to uniquely identify them.

In [32]:
segments['type'] = 'foo'
pd.merge(vessels, segments, left_index=True, right_on='mmsi').head()
Out[32]:
   num_names                                              names sov     flag  \
0          8  Bil Holman Dredge/Dredge Capt Frank/Emo/Offsho...   Y  Unknown   
1          8  Bil Holman Dredge/Dredge Capt Frank/Emo/Offsho...   Y  Unknown   
2          8  Bil Holman Dredge/Dredge Capt Frank/Emo/Offsho...   Y  Unknown   
3          8  Bil Holman Dredge/Dredge Capt Frank/Emo/Offsho...   Y  Unknown   
4          8  Bil Holman Dredge/Dredge Capt Frank/Emo/Offsho...   Y  Unknown   

  flag_type  num_loas                                    loa  max_loa  \
0   Unknown         7  42.0/48.0/57.0/90.0/138.0/154.0/156.0      156   
1   Unknown         7  42.0/48.0/57.0/90.0/138.0/154.0/156.0      156   
2   Unknown         7  42.0/48.0/57.0/90.0/138.0/154.0/156.0      156   
3   Unknown         7  42.0/48.0/57.0/90.0/138.0/154.0/156.0      156   
4   Unknown         7  42.0/48.0/57.0/90.0/138.0/154.0/156.0      156   

   num_types                           type_x  \
0          4  Dredging/MilOps/Reserved/Towing   
1          4  Dredging/MilOps/Reserved/Towing   
2          4  Dredging/MilOps/Reserved/Towing   
3          4  Dredging/MilOps/Reserved/Towing   
4          4  Dredging/MilOps/Reserved/Towing   

                ...                 transit segment  seg_length  avg_sog  \
0               ...                       1       1         5.1     13.2   
1               ...                       1       1        13.5     18.6   
2               ...                       1       1         4.3     16.2   
3               ...                       2       1         9.2     15.4   
4               ...                       2       1         9.2     15.4   

   min_sog  max_sog  pdgt10        st_time       end_time type_y  
0      9.2     14.5    96.5  2/10/09 16:03  2/10/09 16:27    foo  
1     10.4     20.6   100.0   4/6/09 14:31   4/6/09 15:20    foo  
2     10.3     20.5   100.0   4/6/09 14:36   4/6/09 14:55    foo  
3     14.5     16.1   100.0  4/10/09 17:58  4/10/09 18:34    foo  
4     14.6     16.2   100.0  4/10/09 17:59  4/10/09 18:35    foo  

[5 rows x 22 columns]

This behavior can be overridden by specifying a suffixes argument, containing a list of the suffixes to be used for the columns of the left and right columns, respectively.

Concatenation

A common data manipulation is appending rows or columns to a dataset that already conform to the dimensions of the exsiting rows or colums, respectively. In NumPy, this is done either with concatenate or the convenience functions c_ and r_:

In [33]:
np.concatenate([np.random.random(5), np.random.random(5)])
Out[33]:
array([ 0.95922038,  0.39563796,  0.13163705,  0.94429727,  0.01549658,
        0.12911028,  0.75731272,  0.01583536,  0.56940704,  0.34045001])
In [34]:
np.r_[np.random.random(5), np.random.random(5)]
Out[34]:
array([ 0.80586099,  0.34971419,  0.39173205,  0.61992008,  0.64169057,
        0.31249921,  0.97907553,  0.18102001,  0.67703841,  0.25629399])
In [35]:
np.c_[np.random.random(5), np.random.random(5)]
Out[35]:
array([[ 0.40759603,  0.66875812],
       [ 0.75010699,  0.64254533],
       [ 0.19492038,  0.04028105],
       [ 0.139481  ,  0.96799951],
       [ 0.81245418,  0.83274143]])

This operation is also called binding or stacking.

With Pandas' indexed data structures, there are additional considerations as the overlap in index values between two data structures affects how they are concatenate.

Lets import two microbiome datasets, each consisting of counts of microorganiams from a particular patient. We will use the first column of each dataset as the index.

In [36]:
mb1 = pd.read_excel('data/microbiome/MID1.xls', 'Sheet 1', index_col=0, header=None)
mb2 = pd.read_excel('data/microbiome/MID2.xls', 'Sheet 1', index_col=0, header=None)
mb1.shape, mb2.shape
Out[36]:
((272, 1), (288, 1))
In [37]:
mb1.head()
Out[37]:
                                                                                         1
0                                                                                         
Archaea "Crenarchaeota" Thermoprotei Desulfurococcales Desulfurococcaceae Ignisphaera    7
Archaea "Crenarchaeota" Thermoprotei Desulfurococcales Pyrodictiaceae Pyrolobus          2
Archaea "Crenarchaeota" Thermoprotei Sulfolobales Sulfolobaceae Stygiolobus              3
Archaea "Crenarchaeota" Thermoprotei Thermoproteales Thermofilaceae Thermofilum          3
Archaea "Euryarchaeota" "Methanomicrobia" Methanocellales Methanocellaceae Methanocella  7

Let's give the index and columns meaningful labels:

In [38]:
mb1.columns = mb2.columns = ['Count']
In [39]:
mb1.index.name = mb2.index.name = 'Taxon'
In [40]:
mb1.head()
Out[40]:
                                                                                         Count
Taxon                                                                                         
Archaea "Crenarchaeota" Thermoprotei Desulfurococcales Desulfurococcaceae Ignisphaera        7
Archaea "Crenarchaeota" Thermoprotei Desulfurococcales Pyrodictiaceae Pyrolobus              2
Archaea "Crenarchaeota" Thermoprotei Sulfolobales Sulfolobaceae Stygiolobus                  3
Archaea "Crenarchaeota" Thermoprotei Thermoproteales Thermofilaceae Thermofilum              3
Archaea "Euryarchaeota" "Methanomicrobia" Methanocellales Methanocellaceae Methanocella      7

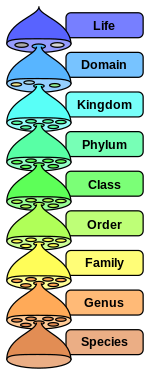
The index of these data is the unique biological classification of each organism, beginning with domain, phylum, class, and for some organisms, going all the way down to the genus level.

classification

In [41]:
mb1.index[:3]
Out[41]:
Index([u'Archaea "Crenarchaeota" Thermoprotei Desulfurococcales Desulfurococcaceae Ignisphaera', u'Archaea "Crenarchaeota" Thermoprotei Desulfurococcales Pyrodictiaceae Pyrolobus', u'Archaea "Crenarchaeota" Thermoprotei Sulfolobales Sulfolobaceae Stygiolobus'], dtype='object')
In [42]:
mb1.index.is_unique
Out[42]:
True

If we concatenate along axis=0 (the default), we will obtain another data frame with the the rows concatenated:

In [43]:
pd.concat([mb1, mb2], axis=0).shape
Out[43]:
(560, 1)

However, the index is no longer unique, due to overlap between the two DataFrames.

In [44]:
pd.concat([mb1, mb2], axis=0).index.is_unique
Out[44]:
False

Concatenating along axis=1 will concatenate column-wise, but respecting the indices of the two DataFrames.

In [45]:
pd.concat([mb1, mb2], axis=1).shape
Out[45]:
(438, 2)
In [46]:
pd.concat([mb1, mb2], axis=1).head()
Out[46]:
                                                                                            Count  \
Archaea "Crenarchaeota" Thermoprotei Acidilobales Acidilobaceae Acidilobus                    NaN   
Archaea "Crenarchaeota" Thermoprotei Acidilobales Caldisphaeraceae Caldisphaera               NaN   
Archaea "Crenarchaeota" Thermoprotei Desulfurococcales Desulfurococcaceae Ignisphaera           7   
Archaea "Crenarchaeota" Thermoprotei Desulfurococcales Desulfurococcaceae Sulfophobococcus    NaN   
Archaea "Crenarchaeota" Thermoprotei Desulfurococcales Desulfurococcaceae Thermosphaera       NaN   

                                                                                            Count  
Archaea "Crenarchaeota" Thermoprotei Acidilobales Acidilobaceae Acidilobus                      2  
Archaea "Crenarchaeota" Thermoprotei Acidilobales Caldisphaeraceae Caldisphaera                14  
Archaea "Crenarchaeota" Thermoprotei Desulfurococcales Desulfurococcaceae Ignisphaera          23  
Archaea "Crenarchaeota" Thermoprotei Desulfurococcales Desulfurococcaceae Sulfophobococcus      1  
Archaea "Crenarchaeota" Thermoprotei Desulfurococcales Desulfurococcaceae Thermosphaera         2  
In [47]:
pd.concat([mb1, mb2], axis=1).values[:5]
Out[47]:
array([[ nan,   2.],
       [ nan,  14.],
       [  7.,  23.],
       [ nan,   1.],
       [ nan,   2.]])

If we are only interested in taxa that are included in both DataFrames, we can specify a join=inner argument.

In [48]:
pd.concat([mb1, mb2], axis=1, join='inner').head()
Out[48]:
                                                                                         Count  \
Taxon                                                                                            
Archaea "Crenarchaeota" Thermoprotei Desulfurococcales Desulfurococcaceae Ignisphaera        7   
Archaea "Crenarchaeota" Thermoprotei Desulfurococcales Pyrodictiaceae Pyrolobus              2   
Archaea "Crenarchaeota" Thermoprotei Sulfolobales Sulfolobaceae Stygiolobus                  3   
Archaea "Crenarchaeota" Thermoprotei Thermoproteales Thermofilaceae Thermofilum              3   
Archaea "Euryarchaeota" "Methanomicrobia" Methanocellales Methanocellaceae Methanocella      7   

                                                                                         Count  
Taxon                                                                                           
Archaea "Crenarchaeota" Thermoprotei Desulfurococcales Desulfurococcaceae Ignisphaera       23  
Archaea "Crenarchaeota" Thermoprotei Desulfurococcales Pyrodictiaceae Pyrolobus              2  
Archaea "Crenarchaeota" Thermoprotei Sulfolobales Sulfolobaceae Stygiolobus                 10  
Archaea "Crenarchaeota" Thermoprotei Thermoproteales Thermofilaceae Thermofilum              9  
Archaea "Euryarchaeota" "Methanomicrobia" Methanocellales Methanocellaceae Methanocella      9  

If we wanted to use the second table to fill values absent from the first table, we could use combine_first.

In [49]:
mb1.combine_first(mb2).head()
Out[49]:
                                                                                            Count
Taxon                                                                                            
Archaea "Crenarchaeota" Thermoprotei Acidilobales Acidilobaceae Acidilobus                      2
Archaea "Crenarchaeota" Thermoprotei Acidilobales Caldisphaeraceae Caldisphaera                14
Archaea "Crenarchaeota" Thermoprotei Desulfurococcales Desulfurococcaceae Ignisphaera           7
Archaea "Crenarchaeota" Thermoprotei Desulfurococcales Desulfurococcaceae Sulfophobococcus      1
Archaea "Crenarchaeota" Thermoprotei Desulfurococcales Desulfurococcaceae Thermosphaera         2

We can also create a hierarchical index based on keys identifying the original tables.

In [50]:
pd.concat([mb1, mb2], keys=['patient1', 'patient2']).head()
Out[50]:
                                                                                                  Count
         Taxon                                                                                         
patient1 Archaea "Crenarchaeota" Thermoprotei Desulfurococcales Desulfurococcaceae Ignisphaera        7
         Archaea "Crenarchaeota" Thermoprotei Desulfurococcales Pyrodictiaceae Pyrolobus              2
         Archaea "Crenarchaeota" Thermoprotei Sulfolobales Sulfolobaceae Stygiolobus                  3
         Archaea "Crenarchaeota" Thermoprotei Thermoproteales Thermofilaceae Thermofilum              3
         Archaea "Euryarchaeota" "Methanomicrobia" Methanocellales Methanocellaceae Methanocella      7
In [51]:
pd.concat([mb1, mb2], keys=['patient1', 'patient2']).index.is_unique
Out[51]:
True

Alternatively, you can pass keys to the concatenation by supplying the DataFrames (or Series) as a dict.

In [52]:
pd.concat(dict(patient1=mb1, patient2=mb2), axis=1).head()
Out[52]:
                                                                                            patient1  \
                                                                                               Count   
Archaea "Crenarchaeota" Thermoprotei Acidilobales Acidilobaceae Acidilobus                       NaN   
Archaea "Crenarchaeota" Thermoprotei Acidilobales Caldisphaeraceae Caldisphaera                  NaN   
Archaea "Crenarchaeota" Thermoprotei Desulfurococcales Desulfurococcaceae Ignisphaera              7   
Archaea "Crenarchaeota" Thermoprotei Desulfurococcales Desulfurococcaceae Sulfophobococcus       NaN   
Archaea "Crenarchaeota" Thermoprotei Desulfurococcales Desulfurococcaceae Thermosphaera          NaN   

                                                                                            patient2  
                                                                                               Count  
Archaea "Crenarchaeota" Thermoprotei Acidilobales Acidilobaceae Acidilobus                         2  
Archaea "Crenarchaeota" Thermoprotei Acidilobales Caldisphaeraceae Caldisphaera                   14  
Archaea "Crenarchaeota" Thermoprotei Desulfurococcales Desulfurococcaceae Ignisphaera             23  
Archaea "Crenarchaeota" Thermoprotei Desulfurococcales Desulfurococcaceae Sulfophobococcus         1  
Archaea "Crenarchaeota" Thermoprotei Desulfurococcales Desulfurococcaceae Thermosphaera            2  

If you want concat to work like numpy.concatanate, you may provide the ignore_index=True argument.

Exercise

In the data/microbiome subdirectory, there are 9 spreadsheets of microbiome data that was acquired from high-throughput RNA sequencing procedures, along with a 10th file that describes the content of each. Write code that imports each of the data spreadsheets and combines them into a single DataFrame, adding the identifying information from the metadata spreadsheet as columns in the combined DataFrame.

In [52]:
# Write your answer here

Reshaping DataFrame objects

In the context of a single DataFrame, we are often interested in re-arranging the layout of our data.

This dataset in from Table 6.9 of Statistical Methods for the Analysis of Repeated Measurements by Charles S. Davis, pp. 161-163 (Springer, 2002). These data are from a multicenter, randomized controlled trial of botulinum toxin type B (BotB) in patients with cervical dystonia from nine U.S. sites.

  • Randomized to placebo (N=36), 5000 units of BotB (N=36), 10,000 units of BotB (N=37)
  • Response variable: total score on Toronto Western Spasmodic Torticollis Rating Scale (TWSTRS), measuring severity, pain, and disability of cervical dystonia (high scores mean more impairment)
  • TWSTRS measured at baseline (week 0) and weeks 2, 4, 8, 12, 16 after treatment began
In [53]:
cdystonia = pd.read_csv("data/cdystonia.csv", index_col=None)
cdystonia.head()
Out[53]:
   patient  obs  week  site  id  treat  age sex  twstrs
0        1    1     0     1   1  5000U   65   F      32
1        1    2     2     1   1  5000U   65   F      30
2        1    3     4     1   1  5000U   65   F      24
3        1    4     8     1   1  5000U   65   F      37
4        1    5    12     1   1  5000U   65   F      39

This dataset includes repeated measurements of the same individuals (longitudinal data). Its possible to present such information in (at least) two ways: showing each repeated measurement in their own row, or in multiple columns representing mutliple measurements.

The stack method rotates the data frame so that columns are represented in rows:

In [54]:
stacked = cdystonia.stack()
stacked
Out[54]:
0  patient        1
   obs            1
   week           0
   site           1
   id             1
   treat      5000U
   age           65
   sex            F
   twstrs        32
1  patient        1
...
629  sex            M
     twstrs        36
630  patient      109
     obs            6
     week          16
     site           9
     id            11
     treat      5000U
     age           57
     sex            M
     twstrs        51
Length: 5679, dtype: object

To complement this, unstack pivots from rows back to columns.

In [55]:
stacked.unstack().head()
Out[55]:
  patient obs week site id  treat age sex twstrs
0       1   1    0    1  1  5000U  65   F     32
1       1   2    2    1  1  5000U  65   F     30
2       1   3    4    1  1  5000U  65   F     24
3       1   4    8    1  1  5000U  65   F     37
4       1   5   12    1  1  5000U  65   F     39

For this dataset, it makes sense to create a hierarchical index based on the patient and observation:

In [56]:
cdystonia2 = cdystonia.set_index(['patient','obs'])
cdystonia2.head()
Out[56]:
             week  site  id  treat  age sex  twstrs
patient obs                                        
1       1       0     1   1  5000U   65   F      32
        2       2     1   1  5000U   65   F      30
        3       4     1   1  5000U   65   F      24
        4       8     1   1  5000U   65   F      37
        5      12     1   1  5000U   65   F      39
In [57]:
cdystonia2.index.is_unique
Out[57]:
True

If we want to transform this data so that repeated measurements are in columns, we can unstack the twstrs measurements according to obs.

In [58]:
twstrs_wide = cdystonia2['twstrs'].unstack('obs')
twstrs_wide.head()
Out[58]:
obs       1   2   3   4   5   6
patient                        
1        32  30  24  37  39  36
2        60  26  27  41  65  67
3        44  20  23  26  35  35
4        53  61  64  62 NaN NaN
5        53  35  48  49  41  51
In [59]:
cdystonia_long = cdystonia[['patient','site','id','treat','age','sex']].drop_duplicates().merge(
                    twstrs_wide, right_index=True, left_on='patient', how='inner').head()
cdystonia_long
Out[59]:
    patient  site  id    treat  age sex   1   2   3   4   5   6
0         1     1   1    5000U   65   F  32  30  24  37  39  36
6         2     1   2   10000U   70   F  60  26  27  41  65  67
12        3     1   3    5000U   64   F  44  20  23  26  35  35
18        4     1   4  Placebo   59   F  53  61  64  62 NaN NaN
22        5     1   5   10000U   76   F  53  35  48  49  41  51

A slightly cleaner way of doing this is to set the patient-level information as an index before unstacking:

In [60]:
cdystonia.set_index(['patient','site','id','treat','age','sex','week'])['twstrs'].unstack('week').head()
Out[60]:
week                             0   2   4   8   12  16
patient site id treat   age sex                        
1       1    1  5000U   65  F    32  30  24  37  39  36
2       1    2  10000U  70  F    60  26  27  41  65  67
3       1    3  5000U   64  F    44  20  23  26  35  35
4       1    4  Placebo 59  F    53  61  64  62 NaN NaN
5       1    5  10000U  76  F    53  35  48  49  41  51

To convert our "wide" format back to long, we can use the melt function, appropriately parameterized:

In [61]:
pd.melt(cdystonia_long, id_vars=['patient','site','id','treat','age','sex'], 
        var_name='obs', value_name='twsters').head()
Out[61]:
   patient  site  id    treat  age sex obs  twsters
0        1     1   1    5000U   65   F   1       32
1        2     1   2   10000U   70   F   1       60
2        3     1   3    5000U   64   F   1       44
3        4     1   4  Placebo   59   F   1       53
4        5     1   5   10000U   76   F   1       53

This illustrates the two formats for longitudinal data: long and wide formats. Its typically better to store data in long format because additional data can be included as additional rows in the database, while wide format requires that the entire database schema be altered by adding columns to every row as data are collected.

The preferable format for analysis depends entirely on what is planned for the data, so it is imporant to be able to move easily between them.

Pivoting

The pivot method allows a DataFrame to be transformed easily between long and wide formats in the same way as a pivot table is created in a spreadsheet. It takes three arguments: index, columns and values, corresponding to the DataFrame index (the row headers), columns and cell values, respectively.

For example, we may want the twstrs variable (the response variable) in wide format according to patient:

In [62]:
cdystonia.pivot(index='patient', columns='obs', values='twstrs').head()
Out[62]:
obs       1   2   3   4   5   6
patient                        
1        32  30  24  37  39  36
2        60  26  27  41  65  67
3        44  20  23  26  35  35
4        53  61  64  62 NaN NaN
5        53  35  48  49  41  51

If we omit the values argument, we get a DataFrame with hierarchical columns, just as when we applied unstack to the hierarchically-indexed table:

In [63]:
cdystonia.pivot('patient', 'obs')
Out[63]:
         week                      site             ...  sex                 \
obs         1   2   3   4   5   6     1   2   3   4 ...    3    4    5    6   
patient                                             ...                       
1           0   2   4   8  12  16     1   1   1   1 ...    F    F    F    F   
2           0   2   4   8  12  16     1   1   1   1 ...    F    F    F    F   
3           0   2   4   8  12  16     1   1   1   1 ...    F    F    F    F   
4           0   2   4   8 NaN NaN     1   1   1   1 ...    F    F  NaN  NaN   
5           0   2   4   8  12  16     1   1   1   1 ...    F    F    F    F   
6           0   2   4   8  12  16     1   1   1   1 ...    F    F    F    F   
7           0   2   4   8  12  16     1   1   1   1 ...    M    M    M    M   
8           0   2   4   8  12  16     1   1   1   1 ...    M    M    M    M   
9           0   2   4   8  12  16     1   1   1   1 ...    F    F    F    F   
10          0   2   4   8  12  16     1   1   1   1 ...    M    M    M    M   
11          0   2   4   8  12  16     1   1   1   1 ...    F    F    F    F   
12          0   2   4   8  12  16     1   1   1   1 ...    F    F    F    F   
...       ...  ..  ..  ..  ..  ..   ...  ..  ..  .. ...  ...  ...  ...  ...   
98          0   2   4   8  12  16     8   8   8   8 ...    F    F    F    F   
99          0   2   4   8  12  16     9   9   9   9 ...    M    M    M    M   
100         0   2   4   8  12  16     9   9   9   9 ...    M    M    M    M   
101         0   2   4   8  12  16     9   9   9   9 ...    M    M    M    M   
102         0   2   4   8  12  16     9   9   9   9 ...    F    F    F    F   
103         0   2   4 NaN  12  16     9   9   9 NaN ...    F  NaN    F    F   
104         0   2   4 NaN  12  16     9   9   9 NaN ...    F  NaN    F    F   
105         0   2   4   8  12  16     9   9   9   9 ...    F    F    F    F   
106         0   2   4   8  12  16     9   9   9   9 ...    M    M    M    M   
107         0 NaN   4   8 NaN  16     9 NaN   9   9 ...    M    M  NaN    M   
108         0   2   4   8  12  16     9   9   9   9 ...    F    F    F    F   
109         0   2 NaN   8  12  16     9   9 NaN   9 ...  NaN    M    M    M   

         twstrs             twstrs      
obs           1   2   3   4      5   6  
patient                                 
1            32  30  24  37     39  36  
2            60  26  27  41     65  67  
3            44  20  23  26     35  35  
4            53  61  64  62    NaN NaN  
5            53  35  48  49     41  51  
6            49  34  43  48     48  51  
7            42  32  32  43     42  46  
8            34  33  21  27     32  38  
9            41  32  34  35     37  36  
10           27  10  31  32      6  14  
11           48  41  32  35     57  51  
12           34  19  21  24     28  28  
...         ...  ..  ..  ..    ...  ..  
98           40  28  29  30     37  44  
99           40  16  18  25     33  48  
100          61  52  61  68     59  71  
101          35  21  29  30     35  48  
102          58  38  50  53     47  59  
103          49  45  36 NaN     40  52  
104          52  46  36 NaN     45  54  
105          45  46  33  44     46  48  
106          67  63  71  66     68  71  
107          57 NaN  36  23    NaN  52  
108          63  51  46  50     50  54  
109          53  38 NaN  33     36  51  

[109 rows x 42 columns]

A related method, pivot_table, creates a spreadsheet-like table with a hierarchical index, and allows the values of the table to be populated using an arbitrary aggregation function.

In [64]:
cdystonia.pivot_table(rows=['site', 'treat'], cols='week', values='twstrs', aggfunc=max).head(20)
/usr/local/lib/python2.7/site-packages/pandas/util/decorators.py:53: FutureWarning: cols is deprecated, use columns instead
  warnings.warn(msg, FutureWarning)
/usr/local/lib/python2.7/site-packages/pandas/util/decorators.py:53: FutureWarning: rows is deprecated, use index instead
  warnings.warn(msg, FutureWarning)

Out[64]:
week          0   2   4   8   12  16
site treat                          
1    10000U   60  41  48  49  65  67
     5000U    44  32  34  43  42  46
     Placebo  53  61  64  62  32  38
2    10000U   65  60  60  64  67  66
     5000U    67  64  65  64  62  64
     Placebo  53  56  52  57  61  54
3    10000U   50  43  51  46  49  56
     5000U    52  44  47  50  50  49
     Placebo  43  38  40  48  49  44
4    10000U   54  52  52  54  51  57
     5000U    52  34  43  45  47  46
     Placebo  52  55  51  52  54  57
5    10000U   50  50  32  46  54  57
     5000U    60  53  55  62  67  26
     Placebo  60  57  53  52  53  58
6    10000U   55  56  47  53  51  51
     5000U    59  55  50  56  59  53
     Placebo  54  53  51  57  57  57
7    10000U   53  47  45  45  50  53
     5000U    53  45  52  51  52  53

For a simple cross-tabulation of group frequencies, the crosstab function (not a method) aggregates counts of data according to factors in rows and columns. The factors may be hierarchical if desired.

In [65]:
pd.crosstab(cdystonia.sex, cdystonia.site)
Out[65]:
site   1   2   3   4   5   6   7   8   9
sex                                     
F     52  53  42  30  22  54  66  48  28
M     18  29  30  18  11  33   6  58  33

Data transformation

There are a slew of additional operations for DataFrames that we would collectively refer to as "transformations" that include tasks such as removing duplicate values, replacing values, and grouping values.

Dealing with duplicates

We can easily identify and remove duplicate values from DataFrame objects. For example, say we want to removed ships from our vessels dataset that have the same name:

In [66]:
vessels.duplicated(cols='names')
/usr/local/lib/python2.7/site-packages/pandas/util/decorators.py:53: FutureWarning: cols is deprecated, use subset instead
  warnings.warn(msg, FutureWarning)

Out[66]:
mmsi
1        False
9        False
21       False
74       False
103      False
310      False
3011     False
4731     False
15151    False
46809    False
...
812719000    False
857632392    False
866946820     True
888888882     True
888888888    False
900000000    False
919191919    False
967191190     True
975318642     True
987654321    False
999999999     True
Length: 10771, dtype: bool
In [67]:
vessels.drop_duplicates(['names'])
Out[67]:
           num_names                                              names sov  \
mmsi                                                                          
1                  8  Bil Holman Dredge/Dredge Capt Frank/Emo/Offsho...   Y   
9                  3                         000000009/Raven/Shearwater   N   
21                 1                                      Us Gov Vessel   Y   
74                 2                                  Mcfaul/Sarah Bell   N   
103                3           Ron G/Us Navy Warship 103/Us Warship 103   Y   
310                1                                           Arabella   N   
3011               1                                         Charleston   N   
4731               1                                          000004731   N   
15151              2                             R L Enterkin/Us Vessel   N   
46809              1                                      Island Trader   N   
80404              1                                         Donnamarie   N   
82003              1                                             Alexis   N   
...              ...                                                ...  ..   
730026000          1                                        Pensilvania   N   
730031000          1                                            Macondo   N   
735057548          1                                         Chimborazo   N   
735059037          1                                         B.e Guayas   N   
760101000          1                                          Yacu Puma   N   
770576100          1                                    Capitan Miranda   N   
812719000          1                                   Ocean     Trader   N   
857632392          1                                           Ct Pilot   N   
888888888          1                                         Earl Jones   N   
900000000          3      Capt.webster      Pc/Elk River/Roger Binsfeld   N   
919191919          1                                                 Oi   N   
987654321          2                         Island Lookout/Island Tide   N   

                                     flag flag_type  num_loas  \
mmsi                                                            
1                                 Unknown   Unknown         7   
9                                 Unknown   Unknown         2   
21                                Unknown   Unknown         1   
74                                Unknown   Unknown         1   
103                               Unknown   Unknown         2   
310                              Bermuda    Foreign         1   
3011                            Anguilla    Foreign         1   
4731                 Yemen (Republic of)    Foreign         1   
15151                             Unknown   Unknown         2   
46809               Syrian Arab Republic    Foreign         1   
80404                             Unknown   Unknown         1   
82003                             Unknown   Unknown         1   
...                                   ...       ...       ...   
730026000         Colombia (Republic of)    Foreign         1   
730031000         Colombia (Republic of)    Foreign         1   
735057548                        Ecuador    Foreign         1   
735059037                        Ecuador    Foreign         2   
760101000                           Peru    Foreign         2   
770576100  Uruguay (Eastern Republic of)    Foreign         1   
812719000                         Unknown   Unknown         1   
857632392                         Unknown   Unknown         1   
888888888                         Unknown   Unknown         1   
900000000                         Unknown   Unknown         3   
919191919                         Unknown   Unknown         1   
987654321                         Unknown   Unknown         2   

                                             loa  max_loa  num_types  \
mmsi                                                                   
1          42.0/48.0/57.0/90.0/138.0/154.0/156.0      156          4   
9                                      50.0/62.0       62          2   
21                                         208.0      208          1   
74                                         155.0      155          1   
103                                   26.0/155.0      155          2   
310                                         47.0       47          1   
3011                                       160.0      160          1   
4731                                        30.0       30          1   
15151                                 60.0/175.0      175          1   
46809                                       22.0       22          1   
80404                                       29.0       29          1   
82003                                       29.0       29          2   
...                                          ...      ...        ...   
730026000                                  119.0      119          1   
730031000                                  120.0      120          1   
735057548                                  228.0      228          1   
735059037                              44.0/78.0       78          1   
760101000                            142.0/148.0      148          1   
770576100                                   60.0       60          1   
812719000                                   52.0       52          1   
857632392                                   20.0       20          1   
888888888                                   40.0       40          1   
900000000                        22.0/38.0/351.0      351          3   
919191919                                   20.0       20          1   
987654321                              22.0/23.0       23          2   

                                      type  
mmsi                                        
1          Dredging/MilOps/Reserved/Towing  
9                             Pleasure/Tug  
21                                 Unknown  
74                                 Unknown  
103                         Tanker/Unknown  
310                                Unknown  
3011                                 Other  
4731                               Unknown  
15151                                  Tug  
46809                               Towing  
80404                             Pleasure  
82003                     Fishing/Pleasure  
...                                    ...  
730026000                            Cargo  
730031000                            Cargo  
735057548                           Tanker  
735059037                          Sailing  
760101000                            Cargo  
770576100                          Sailing  
812719000                           Tanker  
857632392                           Diving  
888888888                           Towing  
900000000          Fishing/Reserved/Towing  
919191919                         Pleasure  
987654321                   Fishing/Towing  

[10253 rows x 10 columns]

Value replacement

Frequently, we get data columns that are encoded as strings that we wish to represent numerically for the purposes of including it in a quantitative analysis. For example, consider the treatment variable in the cervical dystonia dataset:

In [68]:
cdystonia.treat.value_counts()
Out[68]:
10000U     213
5000U      211
Placebo    207
dtype: int64

A logical way to specify these numerically is to change them to integer values, perhaps using "Placebo" as a baseline value. If we create a dict with the original values as keys and the replacements as values, we can pass it to the map method to implement the changes.

In [69]:
treatment_map = {'Placebo': 0, '5000U': 1, '10000U': 2}
In [70]:
cdystonia['treatment'] = cdystonia.treat.map(treatment_map)
cdystonia.treatment
Out[70]:
0    1
1    1
2    1
3    1
4    1
5    1
6    2
7    2
8    2
9    2
...
620    2
621    2
622    2
623    2
624    2
625    2
626    1
627    1
628    1
629    1
630    1
Name: treatment, Length: 631, dtype: int64

Alternately, if we simply want to replace particular values in a Series or DataFrame, we can use the replace method.

An example where replacement is useful is dealing with zeros in certain transformations. For example, if we try to take the log of a set of values:

In [71]:
vals = pd.Series([float(i)**10 for i in range(10)])
vals
Out[71]:
0             0
1             1
2          1024
3         59049
4       1048576
5       9765625
6      60466176
7     282475249
8    1073741824
9    3486784401
dtype: float64
In [72]:
np.log(vals)
Out[72]:
0         -inf
1     0.000000
2     6.931472
3    10.986123
4    13.862944
5    16.094379
6    17.917595
7    19.459101
8    20.794415
9    21.972246
dtype: float64

In such situations, we can replace the zero with a value so small that it makes no difference to the ensuing analysis. We can do this with replace.

In [73]:
vals = vals.replace(0, 1e-6)
np.log(vals)
Out[73]:
0   -13.815511
1     0.000000
2     6.931472
3    10.986123
4    13.862944
5    16.094379
6    17.917595
7    19.459101
8    20.794415
9    21.972246
dtype: float64

We can also perform the same replacement that we used map for with replace:

In [74]:
cdystonia2.treat.replace({'Placebo': 0, '5000U': 1, '10000U': 2})
Out[74]:
patient  obs
1        1      1
         2      1
         3      1
         4      1
         5      1
         6      1
2        1      2
         2      2
         3      2
         4      2
...
108      1      2
         2      2
         3      2
         4      2
         5      2
         6      2
109      1      1
         2      1
         4      1
         5      1
         6      1
Name: treat, Length: 631, dtype: int64

Inidcator variables

For some statistical analyses (e.g. regression models or analyses of variance), categorical or group variables need to be converted into columns of indicators--zeros and ones--to create a so-called design matrix. The Pandas function get_dummies (indicator variables are also known as dummy variables) makes this transformation straightforward.

Let's consider the DataFrame containing the ships corresponding to the transit segments on the eastern seaboard. The type variable denotes the class of vessel; we can create a matrix of indicators for this. For simplicity, lets filter out the 5 most common types of ships:

In [75]:
top5 = vessels.type.apply(lambda s: s in vessels.type.value_counts().index[:5])
vessels5 = vessels[top5]
In [76]:
pd.get_dummies(vessels5.type).head(10)
Out[76]:
         Cargo  Pleasure  Sailing  Tanker  Tug
mmsi                                          
15151        0         0        0       0    1
80404        0         1        0       0    0
366235       1         0        0       0    0
587370       0         0        0       0    1
693559       0         0        0       0    1
1233916      0         1        0       0    0
3041300      1         0        0       0    0
3663760      1         0        0       0    0
3688360      1         0        0       0    0
7718175      1         0        0       0    0

Discretization

Pandas' cut function can be used to group continuous or countable data in to bins. Discretization is generally a very bad idea for statistical analysis, so use this function responsibly!

Lets say we want to bin the ages of the cervical dystonia patients into a smaller number of groups:

In [77]:
cdystonia.age.describe()
Out[77]:
count    631.000000
mean      55.616482
std       12.123910
min       26.000000
25%       46.000000
50%       56.000000
75%       65.000000
max       83.000000
dtype: float64

Let's transform these data into decades, beginnnig with individuals in their 20's and ending with those in their 90's:

In [78]:
pd.cut(cdystonia.age, [20,30,40,50,60,70,80,90])[:30]
Out[78]:
 (60, 70]
 (60, 70]
 (60, 70]
 (60, 70]
 (60, 70]
 (60, 70]
 (60, 70]
 (60, 70]
 (60, 70]
 (60, 70]
...
 (50, 60]
 (50, 60]
 (50, 60]
 (70, 80]
 (70, 80]
 (70, 80]
 (70, 80]
 (70, 80]
 (70, 80]
 (50, 60]
 (50, 60]
Levels (7): Index(['(20, 30]', '(30, 40]', '(40, 50]', '(50, 60]',
                   '(60, 70]', '(70, 80]', '(80, 90]'], dtype=object)
Length: 30

The parentheses indicate an open interval, meaning that the interval includes values up to but not including the endpoint, whereas the square bracket is a closed interval, where the endpoint is included in the interval. We can switch the closure to the left side by setting the right flag to False:

In [79]:
pd.cut(cdystonia.age, [20,30,40,50,60,70,80,90], right=False)[:30]
Out[79]:
 [60, 70)
 [60, 70)
 [60, 70)
 [60, 70)
 [60, 70)
 [60, 70)
 [70, 80)
 [70, 80)
 [70, 80)
 [70, 80)
...
 [50, 60)
 [50, 60)
 [50, 60)
 [70, 80)
 [70, 80)
 [70, 80)
 [70, 80)
 [70, 80)
 [70, 80)
 [50, 60)
 [50, 60)
Levels (7): Index(['[20, 30)', '[30, 40)', '[40, 50)', '[50, 60)',
                   '[60, 70)', '[70, 80)', '[80, 90)'], dtype=object)
Length: 30

Since the data are now ordinal, rather than numeric, we can give them labels:

In [80]:
pd.cut(cdystonia.age, [20,40,60,80,90], labels=['young','middle-aged','old','ancient'])[:30]
Out[80]:
 old
 old
 old
 old
 old
 old
 old
 old
 old
 old
...
 middle-aged
 middle-aged
 middle-aged
         old
         old
         old
         old
         old
         old
 middle-aged
 middle-aged
Levels (4): Index(['young', 'middle-aged', 'old', 'ancient'], dtype=object)
Length: 30

A related function qcut uses empirical quantiles to divide the data. If, for example, we want the quartiles -- (0-25%], (25-50%], (50-70%], (75-100%] -- we can just specify 4 intervals, which will be equally-spaced by default:

In [81]:
pd.qcut(cdystonia.age, 4)[:30]
Out[81]:
 (56, 65]
 (56, 65]
 (56, 65]
 (56, 65]
 (56, 65]
 (56, 65]
 (65, 83]
 (65, 83]
 (65, 83]
 (65, 83]
...
 (56, 65]
 (56, 65]
 (56, 65]
 (65, 83]
 (65, 83]
 (65, 83]
 (65, 83]
 (65, 83]
 (65, 83]
 (56, 65]
 (56, 65]
Levels (4): Index(['[26, 46]', '(46, 56]', '(56, 65]', '(65, 83]'], dtype=object)
Length: 30

Alternatively, one can specify custom quantiles to act as cut points:

In [82]:
quantiles = pd.qcut(segments.seg_length, [0, 0.01, 0.05, 0.95, 0.99, 1])
quantiles[:30]
Out[82]:
   (1.8, 7.8]
  (7.8, 45.4]
   (1.8, 7.8]
  (7.8, 45.4]
  (7.8, 45.4]
  (7.8, 45.4]
 (45.4, 89.7]
  (7.8, 45.4]
  (7.8, 45.4]
  (7.8, 45.4]
...
 (7.8, 45.4]
  (1.8, 7.8]
  (1.8, 7.8]
 (7.8, 45.4]
 (7.8, 45.4]
 (7.8, 45.4]
 (7.8, 45.4]
 (7.8, 45.4]
 (7.8, 45.4]
 (7.8, 45.4]
 (7.8, 45.4]
Levels (5): Index(['[1, 1.8]', '(1.8, 7.8]', '(7.8, 45.4]',
                   '(45.4, 89.7]', '(89.7, 1882]'], dtype=object)
Length: 30

Note that you can easily combine discretiztion with the generation of indicator variables shown above:

In [83]:
pd.get_dummies(quantiles).head(10)
Out[83]:
   (1.8, 7.8]  (45.4, 89.7]  (7.8, 45.4]  (89.7, 1882]  [1, 1.8]
0           1             0            0             0         0
1           0             0            1             0         0
2           1             0            0             0         0
3           0             0            1             0         0
4           0             0            1             0         0
5           0             0            1             0         0
6           0             1            0             0         0
7           0             0            1             0         0
8           0             0            1             0         0
9           0             0            1             0         0

Permutation and sampling

For some data analysis tasks, such as simulation, we need to be able to randomly reorder our data, or draw random values from it. Calling NumPy's permutation function with the length of the sequence you want to permute generates an array with a permuted sequence of integers, which can be used to re-order the sequence.

In [84]:
new_order = np.random.permutation(len(segments))
new_order[:30]
Out[84]:
array([183316, 108225,  92326,  60611, 134460, 170622, 117439,  13979,
       243115,  69470,  13594, 160103,  73039, 158974, 220079,  20341,
        87882,   4430, 139083,  23082,  18110, 169543, 169578, 119516,
       227857, 123216, 252938,  52744,  88292, 208914])

Using this sequence as an argument to the take method results in a reordered DataFrame:

In [85]:
segments.take(new_order).head()
Out[85]:
             mmsi           name  transit  segment  seg_length  avg_sog  \
183316  367839000    Us Epa Bold       14        1        17.9      6.0   
108225  366739960       Mckinley      135        1        26.9      8.1   
92326   354591000   Pyxis Leader       30        1        30.3     14.9   
60611   309942000     Dole Chile      178        1        18.5     19.0   
134460  366997360  Norwegian Sea      201        1        25.9      6.9   

        min_sog  max_sog  pdgt10         st_time       end_time type  
183316      5.3      7.1     0.0    7/19/09 7:00   7/19/09 9:23  foo  
108225      7.7      8.7     0.0  10/13/10 22:06  10/14/10 1:23  foo  
92326       7.2     17.2    94.4    8/3/10 22:58    8/4/10 0:59  foo  
60611      15.5     19.8   100.0     5/8/12 4:27    5/8/12 5:26  foo  
134460      6.5      7.1     0.0    4/3/12 10:40   4/3/12 14:26  foo  

Compare this ordering with the original:

In [86]:
segments.head()
Out[86]:
   mmsi               name  transit  segment  seg_length  avg_sog  min_sog  \
0     1        Us Govt Ves        1        1         5.1     13.2      9.2   
1     1  Dredge Capt Frank        1        1        13.5     18.6     10.4   
2     1      Us Gov Vessel        1        1         4.3     16.2     10.3   
3     1      Us Gov Vessel        2        1         9.2     15.4     14.5   
4     1  Dredge Capt Frank        2        1         9.2     15.4     14.6   

   max_sog  pdgt10        st_time       end_time type  
0     14.5    96.5  2/10/09 16:03  2/10/09 16:27  foo  
1     20.6   100.0   4/6/09 14:31   4/6/09 15:20  foo  
2     20.5   100.0   4/6/09 14:36   4/6/09 14:55  foo  
3     16.1   100.0  4/10/09 17:58  4/10/09 18:34  foo  
4     16.2   100.0  4/10/09 17:59  4/10/09 18:35  foo  

Exercise

Its easy to see how this permutation approach allows us to draw a random sample without replacement. How would you sample with replacement? Generate a random sample of 5 ships from the vessels DataFrame using this scheme.

In [86]:
# Write your answer here

Data aggregation and GroupBy operations

One of the most powerful features of Pandas is its GroupBy functionality. On occasion we may want to perform operations on groups of observations within a dataset. For exmaple:

  • aggregation, such as computing the sum of mean of each group, which involves applying a function to each group and returning the aggregated results
  • slicing the DataFrame into groups and then doing something with the resulting slices (e.g. plotting)
  • group-wise transformation, such as standardization/normalization
In [87]:
cdystonia_grouped = cdystonia.groupby(cdystonia.patient)

This grouped dataset is hard to visualize

In [88]:
cdystonia_grouped
Out[88]:
<pandas.core.groupby.DataFrameGroupBy object at 0x118e293d0>

However, the grouping is only an intermediate step; for example, we may want to iterate over each of the patient groups:

In [89]:
for patient, group in cdystonia_grouped:
    print patient
    print group
    print
1
   patient  obs  week  site  id  treat  age sex  twstrs  treatment
0        1    1     0     1   1  5000U   65   F      32          1
1        1    2     2     1   1  5000U   65   F      30          1
2        1    3     4     1   1  5000U   65   F      24          1
3        1    4     8     1   1  5000U   65   F      37          1
4        1    5    12     1   1  5000U   65   F      39          1
5        1    6    16     1   1  5000U   65   F      36          1

2
    patient  obs  week  site  id   treat  age sex  twstrs  treatment
6         2    1     0     1   2  10000U   70   F      60          2
7         2    2     2     1   2  10000U   70   F      26          2
8         2    3     4     1   2  10000U   70   F      27          2
9         2    4     8     1   2  10000U   70   F      41          2
10        2    5    12     1   2  10000U   70   F      65          2
11        2    6    16     1   2  10000U   70   F      67          2

3
    patient  obs  week  site  id  treat  age sex  twstrs  treatment
12        3    1     0     1   3  5000U   64   F      44          1
13        3    2     2     1   3  5000U   64   F      20          1
14        3    3     4     1   3  5000U   64   F      23          1
15        3    4     8     1   3  5000U   64   F      26          1
16        3    5    12     1   3  5000U   64   F      35          1
17        3    6    16     1   3  5000U   64   F      35          1

4
    patient  obs  week  site  id    treat  age sex  twstrs  treatment
18        4    1     0     1   4  Placebo   59   F      53          0
19        4    2     2     1   4  Placebo   59   F      61          0
20        4    3     4     1   4  Placebo   59   F      64          0
21        4    4     8     1   4  Placebo   59   F      62          0

5
    patient  obs  week  site  id   treat  age sex  twstrs  treatment
22        5    1     0     1   5  10000U   76   F      53          2
23        5    2     2     1   5  10000U   76   F      35          2
24        5    3     4     1   5  10000U   76   F      48          2
25        5    4     8     1   5  10000U   76   F      49          2
26        5    5    12     1   5  10000U   76   F      41          2
27        5    6    16     1   5  10000U   76   F      51          2

6
    patient  obs  week  site  id   treat  age sex  twstrs  treatment
28        6    1     0     1   6  10000U   59   F      49          2
29        6    2     2     1   6  10000U   59   F      34          2
30        6    3     4     1   6  10000U   59   F      43          2
31        6    4     8     1   6  10000U   59   F      48          2
32        6    5    12     1   6  10000U   59   F      48          2
33        6    6    16     1   6  10000U   59   F      51          2

7
    patient  obs  week  site  id  treat  age sex  twstrs  treatment
34        7    1     0     1   7  5000U   72   M      42          1
35        7    2     2     1   7  5000U   72   M      32          1
36        7    3     4     1   7  5000U   72   M      32          1
37        7    4     8     1   7  5000U   72   M      43          1
38        7    5    12     1   7  5000U   72   M      42          1
39        7    6    16     1   7  5000U   72   M      46          1

8
    patient  obs  week  site  id    treat  age sex  twstrs  treatment
40        8    1     0     1   8  Placebo   40   M      34          0
41        8    2     2     1   8  Placebo   40   M      33          0
42        8    3     4     1   8  Placebo   40   M      21          0
43        8    4     8     1   8  Placebo   40   M      27          0
44        8    5    12     1   8  Placebo   40   M      32          0
45        8    6    16     1   8  Placebo   40   M      38          0

9
    patient  obs  week  site  id  treat  age sex  twstrs  treatment
46        9    1     0     1   9  5000U   52   F      41          1
47        9    2     2     1   9  5000U   52   F      32          1
48        9    3     4     1   9  5000U   52   F      34          1
49        9    4     8     1   9  5000U   52   F      35          1
50        9    5    12     1   9  5000U   52   F      37          1
51        9    6    16     1   9  5000U   52   F      36          1

10
    patient  obs  week  site  id    treat  age sex  twstrs  treatment
52       10    1     0     1  10  Placebo   47   M      27          0
53       10    2     2     1  10  Placebo   47   M      10          0
54       10    3     4     1  10  Placebo   47   M      31          0
55       10    4     8     1  10  Placebo   47   M      32          0
56       10    5    12     1  10  Placebo   47   M       6          0
57       10    6    16     1  10  Placebo   47   M      14          0

11
    patient  obs  week  site  id   treat  age sex  twstrs  treatment
58       11    1     0     1  11  10000U   57   F      48          2
59       11    2     2     1  11  10000U   57   F      41          2
60       11    3     4     1  11  10000U   57   F      32          2
61       11    4     8     1  11  10000U   57   F      35          2
62       11    5    12     1  11  10000U   57   F      57          2
63       11    6    16     1  11  10000U   57   F      51          2

12
    patient  obs  week  site  id    treat  age sex  twstrs  treatment
64       12    1     0     1  12  Placebo   47   F      34          0
65       12    2     2     1  12  Placebo   47   F      19          0
66       12    3     4     1  12  Placebo   47   F      21          0
67       12    4     8     1  12  Placebo   47   F      24          0
68       12    5    12     1  12  Placebo   47   F      28          0
69       12    6    16     1  12  Placebo   47   F      28          0

13
    patient  obs  week  site  id    treat  age sex  twstrs  treatment
70       13    1     0     2   1  Placebo   70   F      49          0
71       13    2     2     2   1  Placebo   70   F      47          0
72       13    3     4     2   1  Placebo   70   F      44          0
73       13    4     8     2   1  Placebo   70   F      48          0
74       13    5    12     2   1  Placebo   70   F      44          0
75       13    6    16     2   1  Placebo   70   F      44          0

14
    patient  obs  week  site  id  treat  age sex  twstrs  treatment
76       14    1     0     2   2  5000U   49   F      46          1
77       14    2     2     2   2  5000U   49   F      35          1
78       14    3     4     2   2  5000U   49   F      45          1
79       14    4     8     2   2  5000U   49   F      49          1
80       14    5    12     2   2  5000U   49   F      53          1
81       14    6    16     2   2  5000U   49   F      56          1

15
    patient  obs  week  site  id   treat  age sex  twstrs  treatment
82       15    1     0     2   3  10000U   59   F      56          2
83       15    2     2     2   3  10000U   59   F      44          2
84       15    3     4     2   3  10000U   59   F      48          2
85       15    4     8     2   3  10000U   59   F      54          2
86       15    5    12     2   3  10000U   59   F      49          2
87       15    6    16     2   3  10000U   59   F      60          2

16
    patient  obs  week  site  id  treat  age sex  twstrs  treatment
88       16    1     0     2   4  5000U   64   M      59          1
89       16    2     2     2   4  5000U   64   M      48          1
90       16    3     4     2   4  5000U   64   M      56          1
91       16    4     8     2   4  5000U   64   M      55          1
92       16    5    12     2   4  5000U   64   M      57          1
93       16    6    16     2   4  5000U   64   M      58          1

17
    patient  obs  week  site  id   treat  age sex  twstrs  treatment
94       17    1     0     2   5  10000U   45   F      62          2
95       17    2     2     2   5  10000U   45   F      60          2
96       17    3     4     2   5  10000U   45   F      60          2
97       17    4     8     2   5  10000U   45   F      64          2
98       17    5    12     2   5  10000U   45   F      67          2
99       17    6    16     2   5  10000U   45   F      66          2

18
     patient  obs  week  site  id    treat  age sex  twstrs  treatment
100       18    1     0     2   6  Placebo   66   F      50          0
101       18    2     2     2   6  Placebo   66   F      53          0
102       18    3     4     2   6  Placebo   66   F      52          0
103       18    4     8     2   6  Placebo   66   F      57          0
104       18    5    12     2   6  Placebo   66   F      61          0
105       18    6    16     2   6  Placebo   66   F      54          0

19
     patient  obs  week  site  id   treat  age sex  twstrs  treatment
106       19    1     0     2   7  10000U   49   F      42          2
107       19    2     2     2   7  10000U   49   F      42          2
108       19    3     4     2   7  10000U   49   F      43          2
109       19    4     8     2   7  10000U   49   F      33          2
110       19    5    12     2   7  10000U   49   F      37          2
111       19    6    16     2   7  10000U   49   F      43          2

20
     patient  obs  week  site  id    treat  age sex  twstrs  treatment
112       20    1     0     2   8  Placebo   54   F      53          0
113       20    2     2     2   8  Placebo   54   F      56          0
114       20    3     4     2   8  Placebo   54   F      52          0
115       20    4     8     2   8  Placebo   54   F      54          0
116       20    5    12     2   8  Placebo   54   F      55          0
117       20    6    16     2   8  Placebo   54   F      51          0

21
     patient  obs  week  site  id  treat  age sex  twstrs  treatment
118       21    1     0     2   9  5000U   47   F      67          1
119       21    2     2     2   9  5000U   47   F      64          1
120       21    3     4     2   9  5000U   47   F      65          1
121       21    4     8     2   9  5000U   47   F      64          1
122       21    5    12     2   9  5000U   47   F      62          1
123       21    6    16     2   9  5000U   47   F      64          1

22
     patient  obs  week  site  id    treat  age sex  twstrs  treatment
124       22    1     0     2  10  Placebo   31   M      44          0
125       22    2     2     2  10  Placebo   31   M      40          0
126       22    3     4     2  10  Placebo   31   M      32          0
127       22    4     8     2  10  Placebo   31   M      36          0
128       22    5    12     2  10  Placebo   31   M      42          0
129       22    6    16     2  10  Placebo   31   M      43          0

23
     patient  obs  week  site  id   treat  age sex  twstrs  treatment
130       23    1     0     2  11  10000U   53   F      65          2
131       23    2     2     2  11  10000U   53   F      58          2
132       23    3     4     2  11  10000U   53   F      55          2
133       23    5    12     2  11  10000U   53   F      56          2
134       23    6    16     2  11  10000U   53   F      60          2

24
     patient  obs  week  site  id  treat  age sex  twstrs  treatment
135       24    1     0     2  12  5000U   61   M      56          1
136       24    2     2     2  12  5000U   61   M      54          1
137       24    3     4     2  12  5000U   61   M      52          1
138       24    4     8     2  12  5000U   61   M      48          1
139       24    5    12     2  12  5000U   61   M      52          1
140       24    6    16     2  12  5000U   61   M      53          1

25
     patient  obs  week  site  id    treat  age sex  twstrs  treatment
141       25    1     0     2  13  Placebo   40   M      30          0
142       25    2     2     2  13  Placebo   40   M      33          0
143       25    3     4     2  13  Placebo   40   M      25          0
144       25    4     8     2  13  Placebo   40   M      29          0
145       25    5    12     2  13  Placebo   40   M      32          0
146       25    6    16     2  13  Placebo   40   M      32          0

26
     patient  obs  week  site  id  treat  age sex  twstrs  treatment
147       26    1     0     2  14  5000U   67   M      47          1
148       26    3     4     2  14  5000U   67   M      54          1
149       26    4     8     2  14  5000U   67   M      43          1
150       26    5    12     2  14  5000U   67   M      46          1
151       26    6    16     2  14  5000U   67   M      50          1

27
     patient  obs  week  site  id   treat  age sex  twstrs  treatment
152       27    1     0     3   1  10000U   54   F      50          2
153       27    2     2     3   1  10000U   54   F      43          2
154       27    3     4     3   1  10000U   54   F      51          2
155       27    4     8     3   1  10000U   54   F      46          2
156       27    5    12     3   1  10000U   54   F      49          2
157       27    6    16     3   1  10000U   54   F      53          2

28
     patient  obs  week  site  id    treat  age sex  twstrs  treatment
158       28    1     0     3   2  Placebo   41   F      34          0
159       28    2     2     3   2  Placebo   41   F      29          0
160       28    3     4     3   2  Placebo   41   F      27          0
161       28    4     8     3   2  Placebo   41   F      21          0
162       28    5    12     3   2  Placebo   41   F      22          0
163       28    6    16     3   2  Placebo   41   F      22          0

29
     patient  obs  week  site  id  treat  age sex  twstrs  treatment
164       29    1     0     3   3  5000U   66   M      39          1
165       29    2     2     3   3  5000U   66   M      41          1
166       29    3     4     3   3  5000U   66   M      33          1
167       29    4     8     3   3  5000U   66   M      39          1
168       29    5    12     3   3  5000U   66   M      37          1
169       29    6    16     3   3  5000U   66   M      37          1

30
     patient  obs  week  site  id    treat  age sex  twstrs  treatment
170       30    1     0     3   4  Placebo   68   F      43          0
171       30    2     2     3   4  Placebo   68   F      31          0
172       30    3     4     3   4  Placebo   68   F      29          0
173       30    4     8     3   4  Placebo   68   F      28          0
174       30    5    12     3   4  Placebo   68   F      33          0
175       30    6    16     3   4  Placebo   68   F      38          0

31
     patient  obs  week  site  id   treat  age sex  twstrs  treatment
176       31    1     0     3   5  10000U   41   F      46          2
177       31    2     2     3   5  10000U   41   F      26          2
178       31    3     4     3   5  10000U   41   F      29          2
179       31    4     8     3   5  10000U   41   F      33          2
180       31    5    12     3   5  10000U   41   F      45          2
181       31    6    16     3   5  10000U   41   F      56          2

32
     patient  obs  week  site  id  treat  age sex  twstrs  treatment
182       32    1     0     3   6  5000U   77   M      52          1
183       32    2     2     3   6  5000U   77   M      44          1
184       32    3     4     3   6  5000U   77   M      47          1
185       32    4     8     3   6  5000U   77   M      50          1
186       32    5    12     3   6  5000U   77   M      50          1
187       32    6    16     3   6  5000U   77   M      49          1

33
     patient  obs  week  site  id   treat  age sex  twstrs  treatment
188       33    1     0     3   7  10000U   41   M      38          2
189       33    2     2     3   7  10000U   41   M      19          2
190       33    3     4     3   7  10000U   41   M      20          2
191       33    4     8     3   7  10000U   41   M      27          2
192       33    5    12     3   7  10000U   41   M      29          2
193       33    6    16     3   7  10000U   41   M      32          2

34
     patient  obs  week  site  id    treat  age sex  twstrs  treatment
194       34    1     0     3   8  Placebo   56   M      33          0
195       34    2     2     3   8  Placebo   56   M      38          0
196       34    3     4     3   8  Placebo   56   M      40          0
197       34    4     8     3   8  Placebo   56   M      48          0
198       34    5    12     3   8  Placebo   56   M      49          0
199       34    6    16     3   8  Placebo   56   M      44          0

35
     patient  obs  week  site  id  treat  age sex  twstrs  treatment
200       35    1     0     3   9  5000U   46   F      28          1
201       35    2     2     3   9  5000U   46   F      16          1
202       35    3     4     3   9  5000U   46   F      11          1
203       35    4     8     3   9  5000U   46   F       7          1
204       35    5    12     3   9  5000U   46   F      13          1
205       35    6    16     3   9  5000U   46   F      21          1

36
     patient  obs  week  site  id   treat  age sex  twstrs  treatment
206       36    1     0     3  10  10000U   46   F      34          2
207       36    2     2     3  10  10000U   46   F      23          2
208       36    3     4     3  10  10000U   46   F      16          2
209       36    4     8     3  10  10000U   46   F      15          2
210       36    5    12     3  10  10000U   46   F      17          2
211       36    6    16     3  10  10000U   46   F      29          2

37
     patient  obs  week  site  id    treat  age sex  twstrs  treatment
212       37    1     0     3  11  Placebo   47   F      39          0
213       37    2     2     3  11  Placebo   47   F      37          0
214       37    3     4     3  11  Placebo   47   F      39          0
215       37    4     8     3  11  Placebo   47   F      39          0
216       37    5    12     3  11  Placebo   47   F      45          0
217       37    6    16     3  11  Placebo   47   F      43          0

38
     patient  obs  week  site  id  treat  age sex  twstrs  treatment
218       38    1     0     3  12  5000U   35   M      29          1
219       38    2     2     3  12  5000U   35   M      42          1
220       38    3     4     3  12  5000U   35   M      35          1
221       38    4     8     3  12  5000U   35   M      24          1
222       38    5    12     3  12  5000U   35   M      29          1
223       38    6    16     3  12  5000U   35   M      42          1

39
     patient  obs  week  site  id    treat  age sex  twstrs  treatment
224       39    1     0     4   1  Placebo   58   M      52          0
225       39    2     2     4   1  Placebo   58   M      55          0
226       39    3     4     4   1  Placebo   58   M      51          0
227       39    4     8     4   1  Placebo   58   M      52          0
228       39    5    12     4   1  Placebo   58   M      54          0
229       39    6    16     4   1  Placebo   58   M      57          0

40
     patient  obs  week  site  id  treat  age sex  twstrs  treatment
230       40    1     0     4   2  5000U   62   F      52          1
231       40    2     2     4   2  5000U   62   F      30          1
232       40    3     4     4   2  5000U   62   F      43          1
233       40    4     8     4   2  5000U   62   F      45          1
234       40    5    12     4   2  5000U   62   F      47          1
235       40    6    16     4   2  5000U   62   F      46          1

41
     patient  obs  week  site  id   treat  age sex  twstrs  treatment
236       41    1     0     4   3  10000U   73   F      54          2
237       41    2     2     4   3  10000U   73   F      52          2
238       41    3     4     4   3  10000U   73   F      52          2
239       41    4     8     4   3  10000U   73   F      54          2
240       41    5    12     4   3  10000U   73   F      51          2
241       41    6    16     4   3  10000U   73   F      57          2

42
     patient  obs  week  site  id   treat  age sex  twstrs  treatment
242       42    1     0     4   4  10000U   52   F      52          2
243       42    2     2     4   4  10000U   52   F      44          2
244       42    3     4     4   4  10000U   52   F      33          2
245       42    4     8     4   4  10000U   52   F      54          2
246       42    5    12     4   4  10000U   52   F      46          2
247       42    6    16     4   4  10000U   52   F      47          2

43
     patient  obs  week  site  id    treat  age sex  twstrs  treatment
248       43    1     0     4   5  Placebo   53   F      47          0
249       43    2     2     4   5  Placebo   53   F      45          0
250       43    3     4     4   5  Placebo   53   F      41          0
251       43    4     8     4   5  Placebo   53   F      45          0
252       43    5    12     4   5  Placebo   53   F      43          0
253       43    6    16     4   5  Placebo   53   F      41          0

44
     patient  obs  week  site  id  treat  age sex  twstrs  treatment
254       44    1     0     4   6  5000U   69   M      44          1
255       44    2     2     4   6  5000U   69   M      34          1
256       44    3     4     4   6  5000U   69   M      29          1
257       44    4     8     4   6  5000U   69   M      28          1
258       44    5    12     4   6  5000U   69   M      35          1
259       44    6    16     4   6  5000U   69   M      41          1

45
     patient  obs  week  site  id    treat  age sex  twstrs  treatment
260       45    1     0     4   7  Placebo   55   M      42          0
261       45    2     2     4   7  Placebo   55   M      39          0
262       45    3     4     4   7  Placebo   55   M      38          0
263       45    4     8     4   7  Placebo   55   M      47          0
264       45    5    12     4   7  Placebo   55   M      39          0
265       45    6    16     4   7  Placebo   55   M      39          0

46
     patient  obs  week  site  id   treat  age sex  twstrs  treatment
266       46    1     0     4   8  10000U   52   F      42          2
267       46    2     2     4   8  10000U   52   F      14          2
268       46    3     4     4   8  10000U   52   F       9          2
269       46    4     8     4   8  10000U   52   F       9          2
270       46    5    12     4   8  10000U   52   F      16          2
271       46    6    16     4   8  10000U   52   F      33          2

47
     patient  obs  week  site  id   treat  age sex  twstrs  treatment
272       47    1     0     5   1  10000U   51   F      44          2
273       47    2     2     5   1  10000U   51   F      34          2
274       47    3     4     5   1  10000U   51   F      32          2
275       47    4     8     5   1  10000U   51   F      35          2
276       47    5    12     5   1  10000U   51   F      54          2
277       47    6    16     5   1  10000U   51   F      53          2

48
     patient  obs  week  site  id    treat  age sex  twstrs  treatment
278       48    1     0     5   2  Placebo   56   F      60          0
279       48    2     2     5   2  Placebo   56   F      57          0
280       48    3     4     5   2  Placebo   56   F      53          0
281       48    4     8     5   2  Placebo   56   F      52          0
282       48    5    12     5   2  Placebo   56   F      53          0
283       48    6    16     5   2  Placebo   56   F      58          0

49
     patient  obs  week  site  id  treat  age sex  twstrs  treatment
284       49    1     0     5   3  5000U   65   F      60          1
285       49    2     2     5   3  5000U   65   F      53          1
286       49    3     4     5   3  5000U   65   F      55          1
287       49    4     8     5   3  5000U   65   F      62          1
288       49    5    12     5   3  5000U   65   F      67          1

50
     patient  obs  week  site  id   treat  age sex  twstrs  treatment
289       50    1     0     5   4  10000U   35   F      50          2
290       50    2     2     5   4  10000U   35   F      50          2
291       50    4     8     5   4  10000U   35   F      46          2
292       50    5    12     5   4  10000U   35   F      50          2
293       50    6    16     5   4  10000U   35   F      57          2

51
     patient  obs  week  site  id  treat  age sex  twstrs  treatment
294       51    1     0     5   5  5000U   43   M      38          1
295       51    2     2     5   5  5000U   43   M      27          1
296       51    3     4     5   5  5000U   43   M      16          1
297       51    4     8     5   5  5000U   43   M      19          1
298       51    5    12     5   5  5000U   43   M      23          1
299       51    6    16     5   5  5000U   43   M      26          1

52
     patient  obs  week  site  id    treat  age sex  twstrs  treatment
300       52    1     0     5   6  Placebo   61   M      44          0
301       52    3     4     5   6  Placebo   61   M      46          0
302       52    4     8     5   6  Placebo   61   M      26          0
303       52    5    12     5   6  Placebo   61   M      30          0
304       52    6    16     5   6  Placebo   61   M      34          0

53
     patient  obs  week  site  id    treat  age sex  twstrs  treatment
305       53    1     0     6   1  Placebo   43   M      54          0
306       53    2     2     6   1  Placebo   43   M      53          0
307       53    3     4     6   1  Placebo   43   M      51          0
308       53    4     8     6   1  Placebo   43   M      56          0
309       53    5    12     6   1  Placebo   43   M      39          0
310       53    6    16     6   1  Placebo   43   M       9          0

54
     patient  obs  week  site  id   treat  age sex  twstrs  treatment
311       54    1     0     6   2  10000U   64   F      54          2
312       54    2     2     6   2  10000U   64   F      32          2
313       54    3     4     6   2  10000U   64   F      40          2
314       54    4     8     6   2  10000U   64   F      52          2
315       54    5    12     6   2  10000U   64   F      42          2
316       54    6    16     6   2  10000U   64   F      47          2

55
     patient  obs  week  site  id  treat  age sex  twstrs  treatment
317       55    1     0     6   3  5000U   57   M      56          1
318       55    2     2     6   3  5000U   57   M      55          1
319       55    3     4     6   3  5000U   57   M      44          1
320       55    4     8     6   3  5000U   57   M      50          1
321       55    5    12     6   3  5000U   57   M      53          1
322       55    6    16     6   3  5000U   57   M      52          1

56
     patient  obs  week  site  id  treat  age sex  twstrs  treatment
323       56    1     0     6   4  5000U   60   F      51          1
324       56    2     2     6   4  5000U   60   F      50          1
325       56    3     4     6   4  5000U   60   F      50          1
326       56    4     8     6   4  5000U   60   F      56          1
327       56    5    12     6   4  5000U   60   F      59          1
328       56    6    16     6   4  5000U   60   F      53          1

57
     patient  obs  week  site  id   treat  age sex  twstrs  treatment
329       57    1     0     6   5  10000U   44   F      53          2
330       57    2     2     6   5  10000U   44   F      56          2
331       57    3     4     6   5  10000U   44   F      47          2
332       57    4     8     6   5  10000U   44   F      53          2
333       57    5    12     6   5  10000U   44   F      51          2
334       57    6    16     6   5  10000U   44   F      51          2

58
     patient  obs  week  site  id    treat  age sex  twstrs  treatment
335       58    1     0     6   6  Placebo   41   F      36          0
336       58    2     2     6   6  Placebo   41   F      29          0
337       58    3     4     6   6  Placebo   41   F      24          0
338       58    4     8     6   6  Placebo   41   F      32          0
339       58    5    12     6   6  Placebo   41   F      45          0
340       58    6    16     6   6  Placebo   41   F      36          0

59
     patient  obs  week  site  id  treat  age sex  twstrs  treatment
341       59    1     0     6   7  5000U   51   F      59          1
342       59    2     2     6   7  5000U   51   F      53          1
343       59    3     4     6   7  5000U   51   F      45          1
344       59    4     8     6   7  5000U   51   F      44          1
345       59    5    12     6   7  5000U   51   F      50          1
346       59    6    16     6   7  5000U   51   F      48          1

60
     patient  obs  week  site  id    treat  age sex  twstrs  treatment
347       60    1     0     6   8  Placebo   57   F      49          0
348       60    2     2     6   8  Placebo   57   F      50          0
349       60    3     4     6   8  Placebo   57   F      48          0
350       60    4     8     6   8  Placebo   57   F      56          0
351       60    5    12     6   8  Placebo   57   F      49          0
352       60    6    16     6   8  Placebo   57   F      57          0

61
     patient  obs  week  site  id   treat  age sex  twstrs  treatment
353       61    1     0     6   9  10000U   42   F      50          2
354       61    2     2     6   9  10000U   42   F      38          2
355       61    3     4     6   9  10000U   42   F      42          2
356       61    4     8     6   9  10000U   42   F      43          2
357       61    5    12     6   9  10000U   42   F      42          2
358       61    6    16     6   9  10000U   42   F      46          2

62
     patient  obs  week  site  id    treat  age sex  twstrs  treatment
359       62    1     0     6  10  Placebo   48   F      46          0
360       62    2     2     6  10  Placebo   48   F      48          0
361       62    3     4     6  10  Placebo   48   F      46          0
362       62    4     8     6  10  Placebo   48   F      57          0
363       62    5    12     6  10  Placebo   48   F      57          0
364       62    6    16     6  10  Placebo   48   F      49          0

63
     patient  obs  week  site  id   treat  age sex  twstrs  treatment
365       63    1     0     6  11  10000U   57   M      55          2
366       63    2     2     6  11  10000U   57   M      34          2
367       63    3     4     6  11  10000U   57   M      26          2
368       63    4     8     6  11  10000U   57   M      40          2
369       63    5    12     6  11  10000U   57   M      49          2
370       63    6    16     6  11  10000U   57   M      47          2

64
     patient  obs  week  site  id  treat  age sex  twstrs  treatment
371       64    1     0     6  12  5000U   39   M      46          1
372       64    2     2     6  12  5000U   39   M      44          1
373       64    3     4     6  12  5000U   39   M      47          1
374       64    4     8     6  12  5000U   39   M      50          1
375       64    5    12     6  12  5000U   39   M      46          1
376       64    6    16     6  12  5000U   39   M      51          1

65
     patient  obs  week  site  id   treat  age sex  twstrs  treatment
377       65    1     0     6  13  10000U   67   M      34          2
378       65    2     2     6  13  10000U   67   M      31          2
379       65    3     4     6  13  10000U   67   M      25          2

66
     patient  obs  week  site  id  treat  age sex  twstrs  treatment
380       66    1     0     6  14  5000U   39   F      57          1
381       66    2     2     6  14  5000U   39   F      48          1
382       66    3     4     6  14  5000U   39   F      50          1
383       66    4     8     6  14  5000U   39   F      50          1
384       66    5    12     6  14  5000U   39   F      50          1
385       66    6    16     6  14  5000U   39   F      49          1

67
     patient  obs  week  site  id    treat  age sex  twstrs  treatment
386       67    1     0     6  15  Placebo   69   M      41          0
387       67    2     2     6  15  Placebo   69   M      40          0
388       67    3     4     6  15  Placebo   69   M      42          0
389       67    4     8     6  15  Placebo   69   M      38          0
390       67    5    12     6  15  Placebo   69   M      50          0
391       67    6    16     6  15  Placebo   69   M      56          0

68
     patient  obs  week  site  id  treat  age sex  twstrs  treatment
392       68    1     0     7   1  5000U   54   F      49          1
393       68    2     2     7   1  5000U   54   F      25          1
394       68    3     4     7   1  5000U   54   F      30          1
395       68    4     8     7   1  5000U   54   F      41          1
396       68    5    12     7   1  5000U   54   F      41          1
397       68    6    16     7   1  5000U   54   F      31          1

69
     patient  obs  week  site  id    treat  age sex  twstrs  treatment
398       69    1     0     7   2  Placebo   67   F      42          0
399       69    2     2     7   2  Placebo   67   F      30          0
400       69    3     4     7   2  Placebo   67   F      40          0
401       69    4     8     7   2  Placebo   67   F      43          0
402       69    5    12     7   2  Placebo   67   F      36          0
403       69    6    16     7   2  Placebo   67   F      45          0

70
     patient  obs  week  site  id   treat  age sex  twstrs  treatment
404       70    1     0     7   3  10000U   58   F      31          2
405       70    2     2     7   3  10000U   58   F      18          2
406       70    3     4     7   3  10000U   58   F      23          2
407       70    4     8     7   3  10000U   58   F      26          2
408       70    5    12     7   3  10000U   58   F      33          2
409       70    6    16     7   3  10000U   58   F      41          2

71
     patient  obs  week  site  id    treat  age sex  twstrs  treatment
410       71    1     0     7   4  Placebo   72   F      50          0
411       71    2     2     7   4  Placebo   72   F      27          0
412       71    3     4     7   4  Placebo   72   F      43          0
413       71    4     8     7   4  Placebo   72   F      32          0
414       71    5    12     7   4  Placebo   72   F      40          0
415       71    6    16     7   4  Placebo   72   F      47          0

72
     patient  obs  week  site  id   treat  age sex  twstrs  treatment
416       72    1     0     7   5  10000U   65   F      35          2
417       72    2     2     7   5  10000U   65   F      24          2
418       72    3     4     7   5  10000U   65   F      34          2
419       72    4     8     7   5  10000U   65   F      28          2
420       72    5    12     7   5  10000U   65   F      34          2
421       72    6    16     7   5  10000U   65   F      28          2

73
     patient  obs  week  site  id  treat  age sex  twstrs  treatment
422       73    1     0     7   6  5000U   68   F      38          1
423       73    2     2     7   6  5000U   68   F      25          1
424       73    3     4     7   6  5000U   68   F      21          1
425       73    4     8     7   6  5000U   68   F      33          1
426       73    5    12     7   6  5000U   68   F      42          1
427       73    6    16     7   6  5000U   68   F      53          1

74
     patient  obs  week  site  id   treat  age sex  twstrs  treatment
428       74    1     0     7   7  10000U   75   F      53          2
429       74    2     2     7   7  10000U   75   F      40          2
430       74    3     4     7   7  10000U   75   F      38          2
431       74    4     8     7   7  10000U   75   F      44          2
432       74    5    12     7   7  10000U   75   F      47          2
433       74    6    16     7   7  10000U   75   F      53          2

75
     patient  obs  week  site  id    treat  age sex  twstrs  treatment
434       75    1     0     7   8  Placebo   26   F      42          0
435       75    2     2     7   8  Placebo   26   F      48          0
436       75    3     4     7   8  Placebo   26   F      26          0
437       75    4     8     7   8  Placebo   26   F      37          0
438       75    5    12     7   8  Placebo   26   F      37          0
439       75    6    16     7   8  Placebo   26   F      43          0

76
     patient  obs  week  site  id  treat  age sex  twstrs  treatment
440       76    1     0     7   9  5000U   36   F      53          1
441       76    2     2     7   9  5000U   36   F      45          1
442       76    3     4     7   9  5000U   36   F      52          1
443       76    4     8     7   9  5000U   36   F      51          1
444       76    5    12     7   9  5000U   36   F      52          1
445       76    6    16     7   9  5000U   36   F      53          1

77
     patient  obs  week  site  id   treat  age sex  twstrs  treatment
446       77    1     0     7  10  10000U   72   M      46          2
447       77    2     2     7  10  10000U   72   M      47          2
448       77    3     4     7  10  10000U   72   M      45          2
449       77    4     8     7  10  10000U   72   M      45          2
450       77    5    12     7  10  10000U   72   M      50          2
451       77    6    16     7  10  10000U   72   M      52          2

78
     patient  obs  week  site  id    treat  age sex  twstrs  treatment
452       78    1     0     7  11  Placebo   54   F      50          0
453       78    2     2     7  11  Placebo   54   F      42          0
454       78    3     4     7  11  Placebo   54   F      52          0
455       78    4     8     7  11  Placebo   54   F      60          0
456       78    5    12     7  11  Placebo   54   F      54          0
457       78    6    16     7  11  Placebo   54   F      59          0

79
     patient  obs  week  site  id  treat  age sex  twstrs  treatment
458       79    1     0     7  12  5000U   64   F      43          1
459       79    2     2     7  12  5000U   64   F      24          1
460       79    3     4     7  12  5000U   64   F      17          1
461       79    4     8     7  12  5000U   64   F      37          1
462       79    5    12     7  12  5000U   64   F      36          1
463       79    6    16     7  12  5000U   64   F      38          1

80
     patient  obs  week  site  id    treat  age sex  twstrs  treatment
464       80    1     0     8   1  Placebo   39   F      46          0
465       80    2     2     8   1  Placebo   39   F      39          0
466       80    3     4     8   1  Placebo   39   F      25          0
467       80    4     8     8   1  Placebo   39   F      15          0
468       80    5    12     8   1  Placebo   39   F      21          0
469       80    6    16     8   1  Placebo   39   F      25          0

81
     patient  obs  week  site  id   treat  age sex  twstrs  treatment
470       81    1     0     8   2  10000U   54   M      41          2
471       81    2     2     8   2  10000U   54   M      30          2
472       81    3     4     8   2  10000U   54   M      44          2
473       81    4     8     8   2  10000U   54   M      46          2
474       81    5    12     8   2  10000U   54   M      46          2
475       81    6    16     8   2  10000U   54   M      44          2

82
     patient  obs  week  site  id  treat  age sex  twstrs  treatment
476       82    1     0     8   3  5000U   48   M      33          1
477       82    2     2     8   3  5000U   48   M      27          1
478       82    3     4     8   3  5000U   48   M      25          1
479       82    4     8     8   3  5000U   48   M      30          1
480       82    5    12     8   3  5000U   48   M      28          1
481       82    6    16     8   3  5000U   48   M      30          1

83
     patient  obs  week  site  id  treat  age sex  twstrs  treatment
482       83    1     0     8   4  5000U   83   F      36          1
483       83    2     2     8   4  5000U   83   F      15          1
484       83    3     4     8   4  5000U   83   F      16          1
485       83    4     8     8   4  5000U   83   F      17          1
486       83    5    12     8   4  5000U   83   F      22          1
487       83    6    16     8   4  5000U   83   F      41          1

84
     patient  obs  week  site  id   treat  age sex  twstrs  treatment
488       84    1     0     8   5  10000U   74   M      33          2
489       84    2     2     8   5  10000U   74   M      32          2
490       84    3     4     8   5  10000U   74   M      31          2
491       84    4     8     8   5  10000U   74   M      27          2
492       84    5    12     8   5  10000U   74   M      49          2
493       84    6    16     8   5  10000U   74   M      60          2

85
     patient  obs  week  site  id    treat  age sex  twstrs  treatment
494       85    1     0     8   6  Placebo   41   M      37          0

86
     patient  obs  week  site  id   treat  age sex  twstrs  treatment
495       86    1     0     8   7  10000U   65   F      24          2
496       86    2     2     8   7  10000U   65   F      29          2
497       86    3     4     8   7  10000U   65   F      18          2
498       86    4     8     8   7  10000U   65   F      20          2
499       86    5    12     8   7  10000U   65   F      25          2
500       86    6    16     8   7  10000U   65   F      41          2

87
     patient  obs  week  site  id  treat  age sex  twstrs  treatment
501       87    1     0     8   8  5000U   79   M      42          1
502       87    2     2     8   8  5000U   79   M      23          1
503       87    3     4     8   8  5000U   79   M      30          1
504       87    4     8     8   8  5000U   79   M      36          1
505       87    5    12     8   8  5000U   79   M      41          1
506       87    6    16     8   8  5000U   79   M      43          1

88
     patient  obs  week  site  id    treat  age sex  twstrs  treatment
507       88    1     0     8   9  Placebo   63   M      30          0
508       88    2     2     8   9  Placebo   63   M      22          0
509       88    3     4     8   9  Placebo   63   M      21          0
510       88    4     8     8   9  Placebo   63   M      25          0
511       88    5    12     8   9  Placebo   63   M      26          0
512       88    6    16     8   9  Placebo   63   M      33          0

89
     patient  obs  week  site  id    treat  age sex  twstrs  treatment
513       89    1     0     8  10  Placebo   63   F      42          0
514       89    2     2     8  10  Placebo   63   F      46          0
515       89    3     4     8  10  Placebo   63   F      41          0
516       89    4     8     8  10  Placebo   63   F      43          0
517       89    5    12     8  10  Placebo   63   F      49          0
518       89    6    16     8  10  Placebo   63   F      54          0

90
     patient  obs  week  site  id   treat  age sex  twstrs  treatment
519       90    1     0     8  11  10000U   34   F      49          2
520       90    2     2     8  11  10000U   34   F      25          2
521       90    3     4     8  11  10000U   34   F      30          2
522       90    4     8     8  11  10000U   34   F      49          2
523       90    5    12     8  11  10000U   34   F      55          2
524       90    6    16     8  11  10000U   34   F      58          2

91
     patient  obs  week  site  id  treat  age sex  twstrs  treatment
525       91    1     0     8  12  5000U   42   M      58          1
526       91    2     2     8  12  5000U   42   M      46          1
527       91    3     4     8  12  5000U   42   M      46          1
528       91    4     8     8  12  5000U   42   M      50          1
529       91    5    12     8  12  5000U   42   M      56          1
530       91    6    16     8  12  5000U   42   M      60          1

92
     patient  obs  week  site  id    treat  age sex  twstrs  treatment
531       92    1     0     8  13  Placebo   57   M      26          0
532       92    2     2     8  13  Placebo   57   M      26          0
533       92    3     4     8  13  Placebo   57   M      27          0
534       92    4     8     8  13  Placebo   57   M      22          0
535       92    5    12     8  13  Placebo   57   M      38          0
536       92    6    16     8  13  Placebo   57   M      35          0

93
     patient  obs  week  site  id  treat  age sex  twstrs  treatment
537       93    1     0     8  14  5000U   68   M      37          1
538       93    3     4     8  14  5000U   68   M      23          1
539       93    4     8     8  14  5000U   68   M      18          1
540       93    5    12     8  14  5000U   68   M      34          1
541       93    6    16     8  14  5000U   68   M      36          1

94
     patient  obs  week  site  id   treat  age sex  twstrs  treatment
542       94    1     0     8  15  10000U   51   M      40          2
543       94    2     2     8  15  10000U   51   M      24          2
544       94    3     4     8  15  10000U   51   M      25          2
545       94    4     8     8  15  10000U   51   M      37          2
546       94    6    16     8  15  10000U   51   M      38          2

95
     patient  obs  week  site  id  treat  age sex  twstrs  treatment
547       95    1     0     8  16  5000U   51   F      33          1
548       95    2     2     8  16  5000U   51   F      10          1
549       95    3     4     8  16  5000U   51   F      13          1
550       95    4     8     8  16  5000U   51   F      16          1
551       95    5    12     8  16  5000U   51   F      32          1
552       95    6    16     8  16  5000U   51   F      16          1

96
     patient  obs  week  site  id   treat  age sex  twstrs  treatment
553       96    1     0     8  17  10000U   61   F      41          2
554       96    2     2     8  17  10000U   61   F      50          2
555       96    3     4     8  17  10000U   61   F      22          2
556       96    4     8     8  17  10000U   61   F      28          2
557       96    5    12     8  17  10000U   61   F      34          2
558       96    6    16     8  17  10000U   61   F      36          2

97
     patient  obs  week  site  id    treat  age sex  twstrs  treatment
559       97    1     0     8  18  Placebo   42   M      46          0
560       97    3     4     8  18  Placebo   42   M      41          0
561       97    4     8     8  18  Placebo   42   M      41          0
562       97    5    12     8  18  Placebo   42   M      58          0
563       97    6    16     8  18  Placebo   42   M      53          0

98
     patient  obs  week  site  id   treat  age sex  twstrs  treatment
564       98    1     0     8  19  10000U   73   F      40          2
565       98    2     2     8  19  10000U   73   F      28          2
566       98    3     4     8  19  10000U   73   F      29          2
567       98    4     8     8  19  10000U   73   F      30          2
568       98    5    12     8  19  10000U   73   F      37          2
569       98    6    16     8  19  10000U   73   F      44          2

99
     patient  obs  week  site  id   treat  age sex  twstrs  treatment
570       99    1     0     9   1  10000U   57   M      40          2
571       99    2     2     9   1  10000U   57   M      16          2
572       99    3     4     9   1  10000U   57   M      18          2
573       99    4     8     9   1  10000U   57   M      25          2
574       99    5    12     9   1  10000U   57   M      33          2
575       99    6    16     9   1  10000U   57   M      48          2

100
     patient  obs  week  site  id    treat  age sex  twstrs  treatment
576      100    1     0     9   2  Placebo   59   M      61          0
577      100    2     2     9   2  Placebo   59   M      52          0
578      100    3     4     9   2  Placebo   59   M      61          0
579      100    4     8     9   2  Placebo   59   M      68          0
580      100    5    12     9   2  Placebo   59   M      59          0
581      100    6    16     9   2  Placebo   59   M      71          0

101
     patient  obs  week  site  id  treat  age sex  twstrs  treatment
582      101    1     0     9   3  5000U   57   M      35          1
583      101    2     2     9   3  5000U   57   M      21          1
584      101    3     4     9   3  5000U   57   M      29          1
585      101    4     8     9   3  5000U   57   M      30          1
586      101    5    12     9   3  5000U   57   M      35          1
587      101    6    16     9   3  5000U   57   M      48          1

102
     patient  obs  week  site  id    treat  age sex  twstrs  treatment
588      102    1     0     9   4  Placebo   68   F      58          0
589      102    2     2     9   4  Placebo   68   F      38          0
590      102    3     4     9   4  Placebo   68   F      50          0
591      102    4     8     9   4  Placebo   68   F      53          0
592      102    5    12     9   4  Placebo   68   F      47          0
593      102    6    16     9   4  Placebo   68   F      59          0

103
     patient  obs  week  site  id  treat  age sex  twstrs  treatment
594      103    1     0     9   5  5000U   55   F      49          1
595      103    2     2     9   5  5000U   55   F      45          1
596      103    3     4     9   5  5000U   55   F      36          1
597      103    5    12     9   5  5000U   55   F      40          1
598      103    6    16     9   5  5000U   55   F      52          1

104
     patient  obs  week  site  id   treat  age sex  twstrs  treatment
599      104    1     0     9   6  10000U   46   F      52          2
600      104    2     2     9   6  10000U   46   F      46          2
601      104    3     4     9   6  10000U   46   F      36          2
602      104    5    12     9   6  10000U   46   F      45          2
603      104    6    16     9   6  10000U   46   F      54          2

105
     patient  obs  week  site  id    treat  age sex  twstrs  treatment
604      105    1     0     9   7  Placebo   79   F      45          0
605      105    2     2     9   7  Placebo   79   F      46          0
606      105    3     4     9   7  Placebo   79   F      33          0
607      105    4     8     9   7  Placebo   79   F      44          0
608      105    5    12     9   7  Placebo   79   F      46          0
609      105    6    16     9   7  Placebo   79   F      48          0

106
     patient  obs  week  site  id  treat  age sex  twstrs  treatment
610      106    1     0     9   8  5000U   43   M      67          1
611      106    2     2     9   8  5000U   43   M      63          1
612      106    3     4     9   8  5000U   43   M      71          1
613      106    4     8     9   8  5000U   43   M      66          1
614      106    5    12     9   8  5000U   43   M      68          1
615      106    6    16     9   8  5000U   43   M      71          1

107
     patient  obs  week  site  id   treat  age sex  twstrs  treatment
616      107    1     0     9   9  10000U   50   M      57          2
617      107    3     4     9   9  10000U   50   M      36          2
618      107    4     8     9   9  10000U   50   M      23          2
619      107    6    16     9   9  10000U   50   M      52          2

108
     patient  obs  week  site  id   treat  age sex  twstrs  treatment
620      108    1     0     9  10  10000U   39   F      63          2
621      108    2     2     9  10  10000U   39   F      51          2
622      108    3     4     9  10  10000U   39   F      46          2
623      108    4     8     9  10  10000U   39   F      50          2
624      108    5    12     9  10  10000U   39   F      50          2
625      108    6    16     9  10  10000U   39   F      54          2

109
     patient  obs  week  site  id  treat  age sex  twstrs  treatment
626      109    1     0     9  11  5000U   57   M      53          1
627      109    2     2     9  11  5000U   57   M      38          1
628      109    4     8     9  11  5000U   57   M      33          1
629      109    5    12     9  11  5000U   57   M      36          1
630      109    6    16     9  11  5000U   57   M      51          1


A common data analysis procedure is the split-apply-combine operation, which groups subsets of data together, applies a function to each of the groups, then recombines them into a new data table.

For example, we may want to aggregate our data with with some function.

split-apply-combine

(figure taken from "Python for Data Analysis", p.251)

We can aggregate in Pandas using the aggregate (or agg, for short) method:

In [91]:
cdystonia_grouped.agg(np.mean).head()
Out[91]:
         patient  obs  week  site  id  age     twstrs  treatment
patient                                                         
1              1  3.5   7.0     1   1   65  33.000000          1
2              2  3.5   7.0     1   2   70  47.666667          2
3              3  3.5   7.0     1   3   64  30.500000          1
4              4  2.5   3.5     1   4   59  60.000000          0
5              5  3.5   7.0     1   5   76  46.166667          2

Notice that the treat and sex variables are not included in the aggregation. Since it does not make sense to aggregate non-string variables, these columns are simply ignored by the method.

Some aggregation functions are so common that Pandas has a convenience method for them, such as mean:

In [92]:
cdystonia_grouped.mean().head()
Out[92]:
         patient  obs  week  site  id  age     twstrs  treatment
patient                                                         
1              1  3.5   7.0     1   1   65  33.000000          1
2              2  3.5   7.0     1   2   70  47.666667          2
3              3  3.5   7.0     1   3   64  30.500000          1
4              4  2.5   3.5     1   4   59  60.000000          0
5              5  3.5   7.0     1   5   76  46.166667          2

The add_prefix and add_suffix methods can be used to give the columns of the resulting table labels that reflect the transformation:

In [93]:
cdystonia_grouped.mean().add_suffix('_mean').head()
Out[93]:
         patient_mean  obs_mean  week_mean  site_mean  id_mean  age_mean  \
patient                                                                    
1                   1       3.5        7.0          1        1        65   
2                   2       3.5        7.0          1        2        70   
3                   3       3.5        7.0          1        3        64   
4                   4       2.5        3.5          1        4        59   
5                   5       3.5        7.0          1        5        76   

         twstrs_mean  treatment_mean  
patient                               
1          33.000000               1  
2          47.666667               2  
3          30.500000               1  
4          60.000000               0  
5          46.166667               2  
In [94]:
# The median of the `twstrs` variable
cdystonia_grouped['twstrs'].quantile(0.5)
Out[94]:
patient
1          34.0
2          50.5
3          30.5
4          61.5
5          48.5
6          48.0
7          42.0
8          32.5
9          35.5
10         20.5
...
99         29.0
100        61.0
101        32.5
102        51.5
103        45.0
104        46.0
105        45.5
106        67.5
107        44.0
108        50.5
109        38.0
Name: twstrs, Length: 109, dtype: float64

If we wish, we can easily aggregate according to multiple keys:

In [95]:
cdystonia.groupby(['week','site']).mean().head()
Out[95]:
           patient  obs   id        age     twstrs  treatment
week site                                                    
0    1         6.5    1  6.5  59.000000  43.083333   1.000000
     2        19.5    1  7.5  53.928571  51.857143   0.928571
     3        32.5    1  6.5  51.500000  38.750000   1.000000
     4        42.5    1  4.5  59.250000  48.125000   1.000000
     5        49.5    1  3.5  51.833333  49.333333   1.000000

Alternately, we can transform the data, using a function of our choice with the transform method:

In [96]:
normalize = lambda x: (x - x.mean())/x.std()

cdystonia_grouped.transform(normalize).head()
Out[96]:
   patient       obs      week  site  id  age    twstrs  treatment
0      NaN -1.336306 -1.135550   NaN NaN  NaN -0.181369        NaN
1      NaN -0.801784 -0.811107   NaN NaN  NaN -0.544107        NaN
2      NaN -0.267261 -0.486664   NaN NaN  NaN -1.632322        NaN
3      NaN  0.267261  0.162221   NaN NaN  NaN  0.725476        NaN
4      NaN  0.801784  0.811107   NaN NaN  NaN  1.088214        NaN

It is easy to do column selection within groupby operations, if we are only interested split-apply-combine operations on a subset of columns:

In [97]:
cdystonia_grouped['twstrs'].mean().head()
Out[97]:
patient
1          33.000000
2          47.666667
3          30.500000
4          60.000000
5          46.166667
Name: twstrs, dtype: float64
In [98]:
# This gives the same result as a DataFrame
cdystonia_grouped[['twstrs']].mean().head()
Out[98]:
            twstrs
patient           
1        33.000000
2        47.666667
3        30.500000
4        60.000000
5        46.166667

If you simply want to divide your DataFrame into chunks for later use, its easy to convert them into a dict so that they can be easily indexed out as needed:

In [99]:
chunks = dict(list(cdystonia_grouped))
In [100]:
chunks[4]
Out[100]:
    patient  obs  week  site  id    treat  age sex  twstrs  treatment
18        4    1     0     1   4  Placebo   59   F      53          0
19        4    2     2     1   4  Placebo   59   F      61          0
20        4    3     4     1   4  Placebo   59   F      64          0
21        4    4     8     1   4  Placebo   59   F      62          0

By default, groupby groups by row, but we can specify the axis argument to change this. For example, we can group our columns by type this way:

In [101]:
dict(list(cdystonia.groupby(cdystonia.dtypes, axis=1)))
Out[101]:
{dtype('int64'):      patient  obs  week  site  id  age  twstrs  treatment
 0          1    1     0     1   1   65      32          1
 1          1    2     2     1   1   65      30          1
 2          1    3     4     1   1   65      24          1
 3          1    4     8     1   1   65      37          1
 4          1    5    12     1   1   65      39          1
 5          1    6    16     1   1   65      36          1
 6          2    1     0     1   2   70      60          2
 7          2    2     2     1   2   70      26          2
 8          2    3     4     1   2   70      27          2
 9          2    4     8     1   2   70      41          2
 10         2    5    12     1   2   70      65          2
 11         2    6    16     1   2   70      67          2
 ..       ...  ...   ...   ...  ..  ...     ...        ...
 619      107    6    16     9   9   50      52          2
 620      108    1     0     9  10   39      63          2
 621      108    2     2     9  10   39      51          2
 622      108    3     4     9  10   39      46          2
 623      108    4     8     9  10   39      50          2
 624      108    5    12     9  10   39      50          2
 625      108    6    16     9  10   39      54          2
 626      109    1     0     9  11   57      53          1
 627      109    2     2     9  11   57      38          1
 628      109    4     8     9  11   57      33          1
 629      109    5    12     9  11   57      36          1
 630      109    6    16     9  11   57      51          1
 
 [631 rows x 8 columns], dtype('O'):       treat sex
 0     5000U   F
 1     5000U   F
 2     5000U   F
 3     5000U   F
 4     5000U   F
 5     5000U   F
 6    10000U   F
 7    10000U   F
 8    10000U   F
 9    10000U   F
 10   10000U   F
 11   10000U   F
 ..      ...  ..
 619  10000U   M
 620  10000U   F
 621  10000U   F
 622  10000U   F
 623  10000U   F
 624  10000U   F
 625  10000U   F
 626   5000U   M
 627   5000U   M
 628   5000U   M
 629   5000U   M
 630   5000U   M
 
 [631 rows x 2 columns]}

Its also possible to group by one or more levels of a hierarchical index. Recall cdystonia2, which we created with a hierarchical index:

In [102]:
cdystonia2.head(10)
Out[102]:
             week  site  id   treat  age sex  twstrs
patient obs                                         
1       1       0     1   1   5000U   65   F      32
        2       2     1   1   5000U   65   F      30
        3       4     1   1   5000U   65   F      24
        4       8     1   1   5000U   65   F      37
        5      12     1   1   5000U   65   F      39
        6      16     1   1   5000U   65   F      36
2       1       0     1   2  10000U   70   F      60
        2       2     1   2  10000U   70   F      26
        3       4     1   2  10000U   70   F      27
        4       8     1   2  10000U   70   F      41
In [103]:
cdystonia2.groupby(level='obs', axis=0)['twstrs'].mean()
Out[103]:
obs
1      45.651376
2      37.611650
3      37.066038
4      39.807692
5      42.913462
6      45.628571
Name: twstrs, dtype: float64

Apply

We can generalize the split-apply-combine methodology by using apply function. This allows us to invoke any function we wish on a grouped dataset and recombine them into a DataFrame.

The function below takes a DataFrame and a column name, sorts by the column, and takes the n largest values of that column. We can use this with apply to return the largest values from every group in a DataFrame in a single call.

In [104]:
def top(df, column, n=5):
    return df.sort_index(by=column, ascending=False)[:n]

To see this in action, consider the vessel transit segments dataset (which we merged with the vessel information to yield segments_merged). Say we wanted to return the 3 longest segments travelled by each ship:

In [105]:
top3segments = segments_merged.groupby('mmsi').apply(top, column='seg_length', n=3)[['names', 'seg_length']]
top3segments
Out[105]:
                                                              names  \
mmsi                                                                  
1         6       Bil Holman Dredge/Dredge Capt Frank/Emo/Offsho...   
          5       Bil Holman Dredge/Dredge Capt Frank/Emo/Offsho...   
          7       Bil Holman Dredge/Dredge Capt Frank/Emo/Offsho...   
9         15                             000000009/Raven/Shearwater   
          14                             000000009/Raven/Shearwater   
          13                             000000009/Raven/Shearwater   
21        16                                          Us Gov Vessel   
          25                                          Us Gov Vessel   
          30                                          Us Gov Vessel   
74        35                                      Mcfaul/Sarah Bell   
          34                                      Mcfaul/Sarah Bell   
103       37               Ron G/Us Navy Warship 103/Us Warship 103   
...                                                             ...   
967191190 262409                                         Pathfinder   
          262412                                         Pathfinder   
          262423                                         Pathfinder   
975318642 262478                                     Island Express   
          262482                                     Island Express   
          262481                                     Island Express   
987654321 262498                         Island Lookout/Island Tide   
          262507                         Island Lookout/Island Tide   
          262510                         Island Lookout/Island Tide   
999999999 262520                                  Triple Attraction   
          262524                                  Triple Attraction   
          262525                                  Triple Attraction   

                  seg_length  
mmsi                          
1         6             76.0  
          5             17.4  
          7             13.7  
9         15            47.2  
          14            31.4  
          13            19.3  
21        16            48.7  
          25            25.3  
          30            21.7  
74        35             7.4  
          34             1.4  
103       37            87.5  
...                      ...  
967191190 262409        32.7  
          262412        30.6  
          262423        30.4  
975318642 262478        85.8  
          262482        29.5  
          262481        27.7  
987654321 262498        22.5  
          262507        20.9  
          262510        18.6  
999999999 262520        65.0  
          262524        31.5  
          262525        19.8  

[29464 rows x 2 columns]

Notice that additional arguments for the applied function can be passed via apply after the function name. It assumes that the DataFrame is the first argument.

In [106]:
top3segments.head(20)
Out[106]:
                                                     names  seg_length
mmsi                                                                  
1    6   Bil Holman Dredge/Dredge Capt Frank/Emo/Offsho...        76.0
     5   Bil Holman Dredge/Dredge Capt Frank/Emo/Offsho...        17.4
     7   Bil Holman Dredge/Dredge Capt Frank/Emo/Offsho...        13.7
9    15                         000000009/Raven/Shearwater        47.2
     14                         000000009/Raven/Shearwater        31.4
     13                         000000009/Raven/Shearwater        19.3
21   16                                      Us Gov Vessel        48.7
     25                                      Us Gov Vessel        25.3
     30                                      Us Gov Vessel        21.7
74   35                                  Mcfaul/Sarah Bell         7.4
     34                                  Mcfaul/Sarah Bell         1.4
103  37           Ron G/Us Navy Warship 103/Us Warship 103        87.5
     41           Ron G/Us Navy Warship 103/Us Warship 103        62.6
     43           Ron G/Us Navy Warship 103/Us Warship 103        59.1
310  51                                           Arabella        77.4
     58                                           Arabella        30.7
     49                                           Arabella        30.4
3011 74                                         Charleston       121.6
     69                                         Charleston        89.7
     77                                         Charleston        59.7

Recall the microbiome data sets that we used previously for the concatenation example. Suppose that we wish to aggregate the data at a higher biological classification than genus. For example, we can identify samples down to class, which is the 3rd level of organization in each index.

In [107]:
mb1.index[:3]
Out[107]:
Index([u'Archaea "Crenarchaeota" Thermoprotei Desulfurococcales Desulfurococcaceae Ignisphaera', u'Archaea "Crenarchaeota" Thermoprotei Desulfurococcales Pyrodictiaceae Pyrolobus', u'Archaea "Crenarchaeota" Thermoprotei Sulfolobales Sulfolobaceae Stygiolobus'], dtype='object')

Using the string methods split and join we can create an index that just uses the first three classifications: domain, phylum and class.

In [108]:
class_index = mb1.index.map(lambda x: ' '.join(x.split(' ')[:3]))
In [109]:
mb_class = mb1.copy()
mb_class.index = class_index

However, since there are multiple taxonomic units with the same class, our index is no longer unique:

In [110]:
mb_class.head()
Out[110]:
                                           Count
Archaea "Crenarchaeota" Thermoprotei           7
Archaea "Crenarchaeota" Thermoprotei           2
Archaea "Crenarchaeota" Thermoprotei           3
Archaea "Euryarchaeota" "Methanomicrobia"      7

We can re-establish a unique index by summing all rows with the same class, using groupby:

In [111]:
mb_class.groupby(level=0).sum().head(10)
Out[111]:
                                           Count
Archaea "Crenarchaeota" Thermoprotei          15
Archaea "Euryarchaeota" "Methanomicrobia"      9
Archaea "Euryarchaeota" Archaeoglobi           2
Archaea "Euryarchaeota" Halobacteria          12
Archaea "Euryarchaeota" Methanococci           1
Archaea "Euryarchaeota" Methanopyri           12
Archaea "Euryarchaeota" Thermoplasmata         2
Bacteria "Actinobacteria" Actinobacteria    1740
Bacteria "Aquificae" Aquificae                11
Bacteria "Bacteroidetes" "Bacteroidia"         1

Exercise

Load the dataset in titanic.xls. It contains data on all the passengers that travelled on the Titanic.

In [112]:
from IPython.core.display import HTML
HTML(filename='data/titanic.html')
Out[112]:

Data frame:titanic3

1309 observations and 14 variables, maximum # NAs:1188
NameLabelsUnitsLevelsStorageNAs
pclass
3
integer
0
survivedSurvived
double
0
nameName
character
0
sex
2
integer
0
ageAgeYear
double
263
sibspNumber of Siblings/Spouses Aboard
double
0
parchNumber of Parents/Children Aboard
double
0
ticketTicket Number
character
0
farePassenger FareBritish Pound (\243)
double
1
cabin
187
integer
0
embarked
3
integer
2
boat
28
integer
0
bodyBody Identification Number
double
1188
home.destHome/Destination
character
0

VariableLevels
pclass1st
2nd
3rd
sexfemale
male
cabin
A10
A11
A14
A16
A18
A19
A20
A21
A23
A24
A26
A29
A31
A32
A34
A36
A5
A6
A7
A9
B10
B101
B102
B11
B18
B19
B20
B22
B24
B26
B28
B3
B30
B35
B36
B37
B38
B39
B4
B41
B42
B45
B49
B5
B50
B51 B53 B55
B52 B54 B56
B57 B59 B63 B66
B58 B60
B61
B69
B71
B73
B77
B78
B79
B80
B82 B84
B86
B94
B96 B98
C101
C103
C104
C105
C106
C110
C111
C116
C118
C123
C124
C125
C126
C128
C130
C132
C148
C2
C22 C26
C23 C25 C27
C28
C30
C31
C32
C39
C45
C46
C47
C49
C50
C51
C52
C53
C54
C55 C57
C6
C62 C64
C65
C68
C7
C70
C78
C80
C82
C83
C85
C86
C87
C89
C90
C91
C92
C93
C95
C97
C99
D
D10 D12
D11
D15
D17
D19
D20
D21
D22
D26
D28
D30
D33
D34
D35
D36
D37
D38
D40
D43
D45
D46
D47
D48
D49
D50
D56
D6
D7
D9
E10
E101
E12
E121
E17
E24
E25
E31
E33
E34
E36
E38
E39 E41
E40
E44
E45
E46
E49
E50
E52
E58
E60
E63
E67
E68
E77
E8
F
F E46
F E57
F E69
F G63
F G73
F2
F33
F38
F4
G6
T
embarkedCherbourg
Queenstown
Southampton
boat
1
10
11
12
13
13 15
13 15 B
14
15
15 16
16
2
3
4
5
5 7
5 9
6
7
8
8 10
9
A
B
C
C D
D

Women and children first?

  1. Use the groupby method to calculate the proportion of passengers that survived by sex.
  2. Calculate the same proportion, but by class and sex.
  3. Create age categories: children (under 14 years), adolescents (14-20), adult (21-64), and senior(65+), and calculate survival proportions by age category, class and sex.
In [112]:
# Write your answer here


Посты чуть ниже также могут вас заинтересовать

Комментариев нет:

Отправить комментарий